In a nutshell
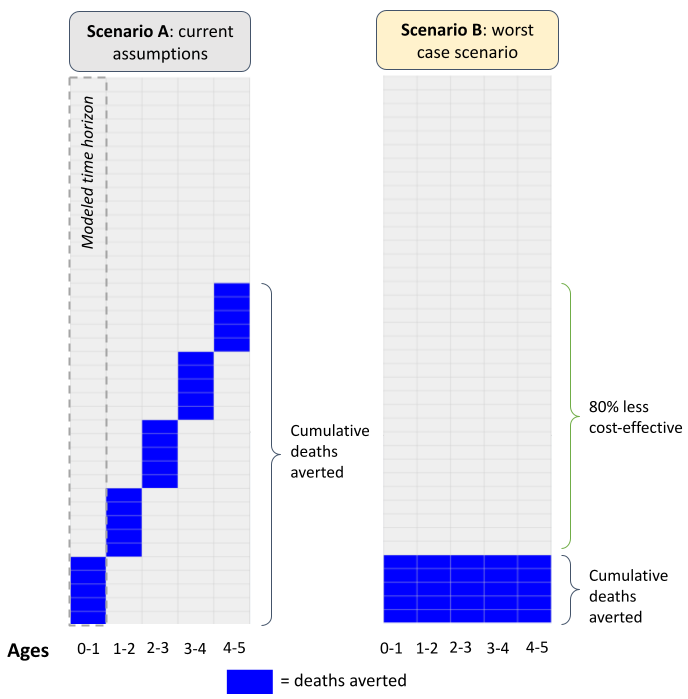
We’ve had a longstanding concern that some of our top charity programs, including insecticide-treated nets, seasonal malaria chemoprevention (SMC), and vitamin A supplementation (VAS), may have less impact than we've estimated due to “repetitive saving.” These programs provide health interventions to the same children under 5 years old annually or every 3 years. Our cost-effectiveness models currently assume that different lives are saved each year from these interventions. We think it's possible the programs are actually saving the same, high-risk children over and over. In a worst-case scenario, this could mean the programs are saving 80% fewer cumulative lives than we thought.
Based on a shallow review of empirical evidence and talking to experts, our best guess is that we're only overstating the total lives saved by these programs by around 10%, because:
- Under-5 deaths from malaria, pneumonia, diarrhea, etc., are concentrated in the first year or two of life. Even if the mortality risk were concentrated among the same children each year, the impact comes from the initial couple of years of treatment, which leaves less scope for repetitive saving in later years.
- The highest-risk group of children appears to vary somewhat randomly each year, reducing overlap. For example, malaria hotspots can shift over time.
This broad conclusion also matches the opinions of two epidemiology experts we consulted.
Our main uncertainties are:
- What about survival after age 5? We focus primarily on survival through age 5, but it’s possible children whose deaths we avert in the under-5 window have lower life expectancy beyond age 5. Though we’ve thought less about this, we think there are both empirical and intuitive reasons to expect longer-term survival benefits from these programs. We also think accounting for life expectancy post-treatment raises difficult moral questions: we’d worry about implicitly weighing lives saved in more deprived contexts as less valuable than others.
- How persistent are at-risk populations? Ideally, we'd directly identify and track the children saved by the programs to see their future risk. In reality, we have to use proxies like children discharged from the hospital after severe malaria. These may not be perfect stand-ins if they developed some immunity or have lingering complications.
Published: May 2024
Summary
What’s the issue?
- Within GiveWell’s research team, there’s been a long standing question: are we overstating the impact of our top charities by failing to account for “repetitive saving”, or averting the same deaths each year? (more)
- 3 of the programs our top charities support—insecticide-treated net campaigns, seasonal malaria chemoprevention (SMC), and vitamin A supplementation (VAS)—provide health commodities repetitively to children under 5 (e.g., they provide a round of SMC to children in one region of Burkina Faso in 2025, then provide another round to those same children in 2026, and so on).
- Our cost-effectiveness models of these programs make the (implicit) assumption that we’re saving a different set of lives each time we provide treatment. What our SMC model says, in effect, is: “a subset of children are saved in year 1 and returned to average life expectancy; in year 2, a different subset of children are saved and returned to average life expectancy”.
- This could be wrong if we’re saving the same set of children each year—for instance, if SMC only delays deaths by a year, rather than returning children to average life expectancy (as we assume).
- In a worst-case scenario, the 5-year SMC program we support might be saving 80% fewer cumulative lives than what we estimate in our model, and hence may be far less cost-effective. Specifically, our cost-effectiveness model currently assumes: (more)
- Children under 5 living in the areas targeted by SMC face a 0.5% risk of dying each year—either directly from malaria or indirectly from other diseases (e.g. pneumonia), which we think can be attributed to malaria infection.1 For simplicity, we assume mortality risk is constant in the under 5 window (i.e. children face a 0.5% risk each year).2
- SMC leads to a 50% reduction in annual malaria mortality.3 Hence, each year we assume there’s a (0.5%*50% =) 0.25% probability we save a life. In a cohort of 1 million children, we estimate that we save (1M*0.25% =) 2,500 lives each year.
- By making the implicit assumption that we save a different set of lives each year, we assume that a 5-year SMC program saves (2,500*5 =) 12,500 lives in total.
- In a worst case scenario—where we hold other assumptions fixed and assume we’ve saving the same lives each year—we’d save 2,500 lives in total: 2,500 children in year 1 then the same 2,500 children in years 2 through 5.
- In the extreme, the SMC program we support might be saving (2,500/12,500-1 =) 80% fewer lives in total, which would mean the program is much less cost-effective.
- Even if we weren’t worried about repetitive saving within the treatment window, we might worry about premature death once treatment ends (more).
- Our models currently assume that when children are counterfactually saved via SMC, they’re returned to average life expectancy. Even if we thought we were saving different children each year, we might worry about this assumption if e.g. SMC was just shifting deaths from early childhood (e.g. ages 0-5) to late childhood (e.g. ages 5-15).
- If children saved via SMC can expect fewer additional life years than what we currently assume, we might consider the program less cost-effective—though we think there are difficult moral questions embedded within this.
What did we find?
- We don’t think repetitive saving is a big concern for our top charities—we guess we’re overestimating cumulative lives saved by ~10% across these programs, because:
- Our top charities target causes of death that are “front-loaded” in the under-5 window (e.g., malaria, diarrhea). So: even if mortality risk was concentrated among the same children each year, the majority of the impact comes from the initial couple of years of treatment. This leaves less scope for repetitive saving in later years, as children get more robust with age (more).
- We guess there’s a moderate level of persistence in which children are at risk of dying from infectious diseases during the under-5 window, but also some year-on-year randomness. The more random you think the at-risk population is each year, the less you need to worry about repetitive saving. For the infectious diseases that our top charities target, we think there’s likely some randomness in the at-risk population year-on-year, because e.g. different places flare up as hotspots at different times (more).
- To put these intuitive arguments into a quantitative framework:
- Our best guess is that, contrary to our current assumptions, malaria mortality is skewed in the under-5 window. In the first year of life, children have a roughly 1.1% risk of dying, which falls to roughly 0.7% in year 2, and 0.4% in year 3, etc.
- With the same treatment effect (~50%), there’s a (~1.1%*~50% =) 0.57% probability we save a life in year 1, (~0.7%*~50% =) 0.37% in year 2, etc. In a cohort of 1 million, we save (1M*0.57%) = 5,700 lives in year 1 and (1M*0.37%) = 3,700 lives in year 2.
- Unlike our current model, we think there is probably some overlap in lives saved, based on intuitive arguments and the relatively poor survival prospects of children discharged from hospital with severe malaria. Our best guess is that 20% of the lives saved in year 2 were the same as in year 1. With a 20% overlap, we save (5,700+3,700*(100%-20%) =) ~8,600 cumulative lives.
- Rolling our skewed mortality and overlap assumptions forward, our best guess is that we save ~11,100 lives in total: 10% fewer than what our current model implies.
- The table below outlines how our current assumptions compare to the worst-case scenario, a scenario that only takes into account a skewed mortality profile, and our best guess. Figure 6 visualizes these results (more).
| Scenario A: current model | Scenario B: worst case | Scenario C: skewed mortality | Scenario D: best guess | |
| Headline parameters | ||||
| Cohort (arbitrary) | 1,000,000 | 1,000,000 | 1,000,000 | 1,000,000 |
| Expected reduction in annual malaria mortality from SMC | 50% | 50% | 50% | 50% |
| Overlap in deaths averted | 0% | 100% | 100% | 20% |
| Probability children die from malaria without treatment | ||||
| Year 1 | 0.50% | 0.50% | 1.13% | 1.13% |
| Year 2 | 0.50% | 0.50% | 0.74% | 0.74% |
| Year 3 | 0.50% | 0.50% | 0.35% | 0.35% |
| Year 4 | 0.50% | 0.50% | 0.18% | 0.18% |
| Year 5 | 0.50% | 0.50% | 0.10% | 0.10% |
| Probability we avert a death given treatment effect | ||||
| Year 1 | 0.25% | 0.25% | 0.57% | 0.57% |
| Year 2 | 0.25% | 0.25% | 0.37% | 0.37% |
| Year 3 | 0.25% | 0.25% | 0.17% | 0.17% |
| Year 4 | 0.25% | 0.25% | 0.09% | 0.09% |
| Year 5 | 0.25% | 0.25% | 0.05% | 0.05% |
| New deaths averted each year given overlap assumption | ||||
| Year 1 | 2,500 | 2,500 | 5,654 | 5,654 |
| Year 2 | 2,500 | 0 | 0 | 2,947 |
| Year 3 | 2,500 | 0 | 0 | 1,388 |
| Year 4 | 2,500 | 0 | 0 | 722 |
| Year 5 | 2,500 | 0 | 0 | 420 |
| Cumulative deaths averted | 12,500 | 2,500 | 5,654 | 11,131 |
| Year 1 | 2,500 | 2,500 | 5,654 | 5,654 |
| Year 2 | 5,000 | 2,500 | 5,654 | 8,601 |
| Year 3 | 7,500 | 2,500 | 5,654 | 9,989 |
| Year 4 | 10,000 | 2,500 | 5,654 | 10,711 |
| Year 5 | 12,500 | 2,500 | 5,654 | 11,131 |
| Implied adjustment | -80% | -55% | -11% | |
- Our bottom-line jibes with the opinion of two epidemiological experts we spoke to—Professor Jay Berkley and Professor David Dowdy—who also didn’t think repetitive saving was a big concern in the context of our top charities, because of similar intuitive reasons.4
- To sense-check this conclusion, we also looked for ‘tell-tale’ signs of repetitive saving in the results of the experimental trials. If repetitive saving was a bigger concern, we would expect to see a rebound in deaths or severe malaria events in trials that prematurely withdrew preventative treatment within the under-5 window. We generally don’t see this, though we don’t put a lot of stock in this sense-check because the trials seem hard to compare and underpowered to detect severe events (more).
- Though we’ve thought less about longer-term life expectancy, we think there are both empirical and intuitive reasons to expect persistent survival benefits from the child health programs our top charities support. That’s because: (more)
- The risk of dying before adulthood is very skewed towards the early years in low- and middle-income countries (LMICs). This jibes with our general understanding of the literature on early childhood development, which points to the early years as a time of unique vulnerability in the human life cycle. We find this suggestive of the idea that if we can get children through this critical window, they should have a good chance of surviving to adulthood.
- Though we couldn’t find long-run mortality follow-ups of our SMC or VAS programs, we found 6 papers which followed children for >6 years after early-life nets distributions, including one which followed children for 22 years. All of these papers found that the initial survival benefits of early-life net use persisted until late childhood or early adulthood, though we think there are limits to how much we can infer from these follow-ups because of non-randomized designs and small samples.
How could we be wrong?
- What is the right parameter for persistence in our model? In an ideal world, we’d identify the children counterfactually saved by SMC and observe their survival prospects. In reality, we can’t observe them, so we use post-discharge children as a proxy. However, these could be a bad proxy if: i) they gained some immunity to malaria death or ii) they have lingering health complications post-discharge, which could bias our persistence estimates upwards (i) or downwards (ii). Our bottom line is quite sensitive to this assumption: for example, if we set it to 40% (our 75th percentile guess), our implied adjustment is -22% instead of -11% (more).
- Should we be accounting for life expectancy within age cohorts in the first place? (more) At the moment, both our moral weights and other measures used by the public health community, like disability-adjusted life years (DALYs), take into account life expectancy across age cohorts—e.g. both assume that averting the death of a 5-year-old is more valuable than averting the death of a 50-year-old, since the 5-year-old can be expected to live longer. However, neither of these measures take into account life expectancy within age cohorts—e.g. neither try to estimate whether 5-year-olds vulnerable to dying from malaria have lower life expectancy than average 5-year-olds. Implicit in the empirical argument outlined is the assumption that life expectancy within age-cohorts is something we ought to account for. We don’t think this is ethically clear-cut; for example:
- On the one hand, if an under-5 health program just delays child deaths to age 6, it seems intuitive that this should count for less than a program that returns children to average life expectancy.
- On the other hand, taking life expectancy within age-cohorts into account may lead us to conclude that under-5 lives saved in Sweden are more valuable than those saved in Burkina Faso, because children in Sweden can expect to live longer. We find this uncomfortable, since it stands at odds with other intuitions we hold about not wanting to ‘double-penalize’ children living in the most deprived contexts. It would also move our moral weights further away from more standard measures like DALYs, which we think is undesirable unless we have good theoretical or empirical reasons to do so.
- If we revisited this life expectancy question, we’d likely consider these moral questions before doing further empirical work.
What’s the issue?
Repetitive saving is a concern that has come up several times at GiveWell as we’ve scrutinized the cost-effectiveness models of our top charities. We haven’t been able to find much discussion of it in the academic literature—at least in the context of the programs our top charities support5 —so we wanted to spell out what this concern is and what we think about it. The concern is:
- Three out of four of our top charities—the Against Malaria Foundation, Malaria Consortium, and Helen Keller International—administer programs which entail the repetitive provision of preventative health commodities to children throughout early childhood (net campaigns, SMC, and VAS, respectively).
- For each of these programs, we model cost-effectiveness across a snapshot of the entire treatment window.6 For example, we model the cost-effectiveness of SMC over a 1-year time horizon, despite the fact that children should—in theory—receive SMC each year for the first 5 years of life.
Figure 1: A simplified version of our SMC model
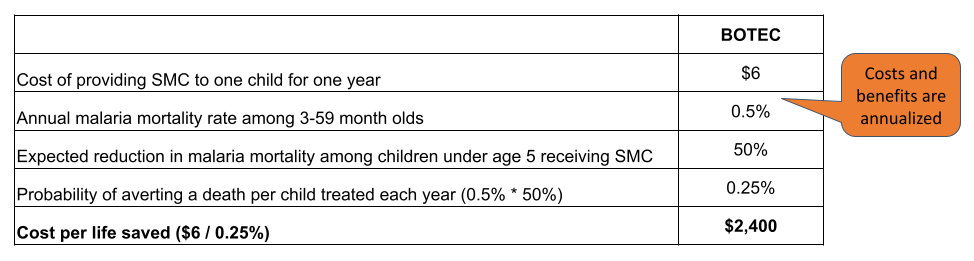
Notes: our full SMC model can be found here. Annual cost of treatment can be found on line 31. The annual mortality rate can be found on line 50. The annual treatment effect is derived from combining the effect of SMC on malaria mortality during the high transmission season (line 49) with the share of malaria deaths occurring during the high transmission season (line 54). The cost per life saved in this simplified model is lower than what’s implied by the full model (~$5,000), because we don’t account for factors like leverage and funging (which lower cost-effectiveness).
- By modeling an incomplete snapshot, we’re making the implicit assumption that yearly costs and benefits can be stacked on top of each other to approximate the cost-effectiveness of a 5-year program. In doing so, our SMC model is effectively saying: “a subset of children are saved in year 1 and returned to average life expectancy; in year 2, a different subset of children are saved and returned to average life expectancy.”
- This could be a bad assumption if our SMC program is saving the lives of the same set of children each year. If so, this could mean we’re saving fewer cumulative lives than what we currently assume. At the extreme—if we hold other assumptions fixed and assume we’ve averting the deaths of exactly the same children each year—a 5-year SMC program could be averting 80% fewer deaths than what we estimate under our current assumptions.
Figure 2: Visualizing our current assumptions
Taking this concern seriously—or even a watered-down version of it—could mean our top charities are considerably less cost-effective than we think, and so perhaps we ought to be directing money away from them and towards adult livelihoods programs (for instance).
Why we don’t think this is a big concern
After looking into this, we don’t think this is a big concern for our top charities—our best guess is that we’re overestimating cost-effectiveness by ~10%. High-level, we think this repetitive saving concern is assuaged or worsened by two underlying drivers:
- The skewness of mortality risk in the treatment window
- The persistence in the at-risk population across time
To show what these drivers look like in practice – and explain why we don’t think repetitive saving is a big concern for our top charities—we apply these drivers to Malaria Consortium’s SMC program, though we’ll also explain how we think the logic carries over to AMF’s nets campaigns and Helen Keller International’s VAS program.
Driver 1: Skewness of mortality risk
In our SMC (and VAS and AMF) models, we make the simplifying assumption that all under-5 children face the same risk of dying each year. This obscures an underlying risk profile that is skewed towards the early years—in the case of malaria, children aged 0-2 are at much greater risk of dying than those aged 2-5.
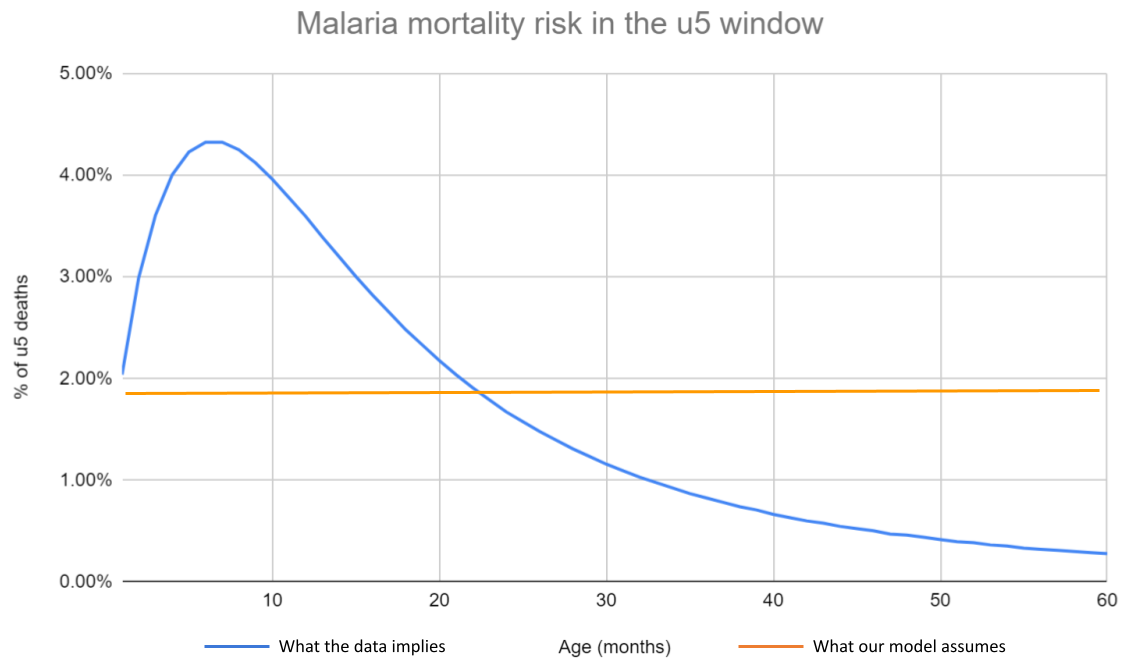
Notes: Disaggregated malaria mortality data is taken from Carneiro et al. (2010), and summarized here. We use the estimates from the ‘high transmission and marked seasonality’ scenario, since this seems the most relevant to our SMC programs. The flatness of our current mortality assumption can be seen on line 50 of our SMC CEA.
The skewness of mortality risk—and how this interacts with the duration of each treatment round—matters for how much you ought to be worried about repetitive saving. Intuitively, if 70% of malaria-related deaths occur in the first year of life, then most of the benefits of a 5-year SMC program will be ‘cashed out’ in the first year, which leaves less scope for repetitive saving in later rounds. All of our top charities target infectious diseases where mortality risk is skewed towards the early years.7 Hence, we feel less worried about repetitive saving, because we think a lot of the impact comes from early treatment rounds ‘pushing children through’ a narrow window of risk in early life.
Two epidemiological experts we spoke to—David Dowdy and Jay Berkley—raised this idea, and both thought that repetitive saving didn’t seem like a big issue (for our top charities) because of this.8 An interesting corollary they also flagged is that SMC programs could be much more cost-effective if they were targeted at 0-2 year olds rather than 0-5 year olds—though the feasibility of this is outside the scope of this piece.9
Figure 4: Getting children over the hump
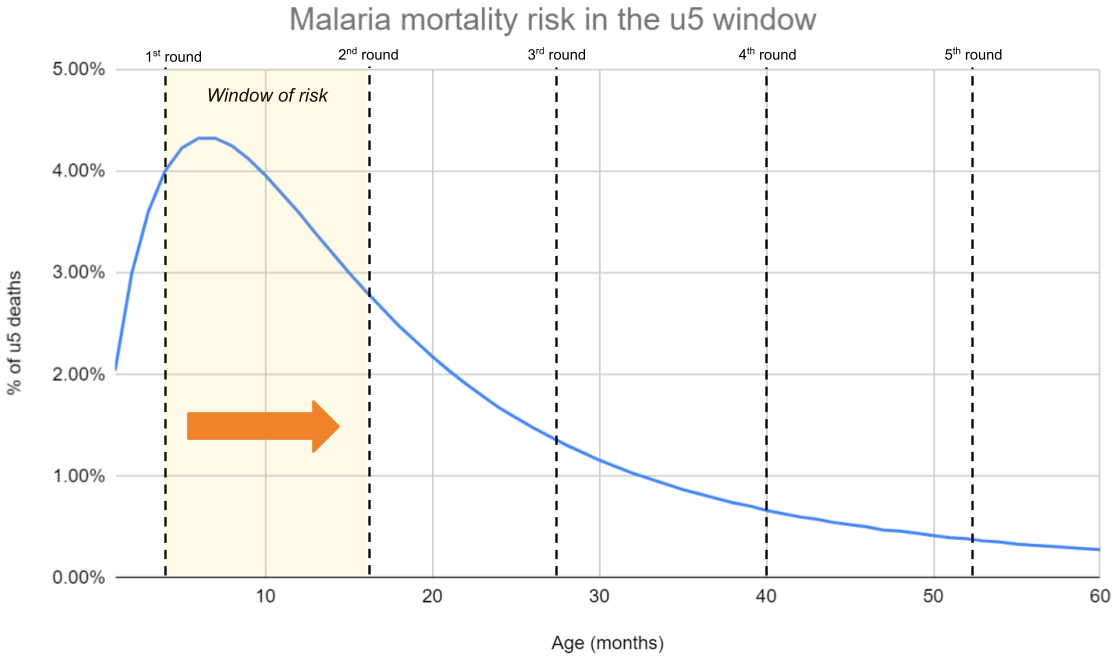
Notes: Data from Carneiro et al. (2010). We overlay a hypothetical treatment schedule for a 3-month-old (the minimum age to receive SMC).
Driver 2: Persistence of the at-risk population
Even if mortality risk isn’t skewed, we don’t think it necessarily follows that repetitive saving is a big concern. As flagged to us by David Dowdy, also relevant is how persistent the at-risk population is across time.10 To get intuition flowing for this, we find it helpful to imagine causes of death that are at opposite extremes of this driver:
- Road traffic accidents: While the at-risk population is not totally random (e.g. men are probably more at risk),11 a given road traffic accident seems like a pretty random occurrence. Hence, if something like the Zusha road safety campaign was rolled out across several years, we’d expect the people being counterfactually saved to be different each year.12
- Type 1 diabetes: Type 1 diabetes has a strong (time invariant) genetic component,13 and individuals also don’t slip in and out of type 1 diabetes status.14 Hence, if we supported a campaign that repeatedly disbursed insulin to those with diabetes, we’d expect it to be broadly the same people that were counterfactually saved across time.
The causes of death that our Top Charities target—infectious diseases—seem somewhere between these two extremes, though probably closer to the diabetes end of the spectrum. On the one hand, there is also a genetic component to malaria risk, as those with sickle cell trait appear more immune compared to those without.15 Socioeconomic status also seems like an important driver of risk, as poorer children are more likely to have comorbidities and less likely to seek treatment in time.16 While poverty is not totally time-invariant, it seems fairly time-invariant, as children born into poor households most likely remain in poor households throughout their early childhood.17
On the other hand, we think there’s likely some year-on-year randomness in the population at risk of dying from infectious disease. Different places flare up as hotspots each year,18 and we’d expect idiosyncratic factors to determine whether children receive treatment in time (e.g. clinic stockouts and household income fluctuations).
To get a handle on the importance of randomness vs. persistence, we would ideally be able to observe the children whose malaria deaths were counterfactually averted via SMC and then follow up on their survival prospects across time. Unfortunately, these children are unobservable, so we need to use a proxy. The proxy we use is the survival prospects of children that have recently been discharged from hospital with severe malaria. Like the children we’re interested in, many of these children would probably have died without malaria treatment, so their survival prospects seem at least partially informative (caveats are discussed here). If the population at risk of malaria death was entirely random across time, we should see no difference in the survival prospects of these children compared to the general population.
- Kwambai et al. (2023) find a 9.3% all-cause mortality risk in the 12 months post-discharge for under-5s hospitalized with severe anemia in Kenya.19 This is much higher than our estimates of annual all-cause mortality risk in the general under-5 population (0.35%)20 —i.e. it implies post-discharge under-5s are (9.3%/0.35%=) ~30 times more likely to die in the next year than the average child under 5.
- Kwambai et al. (2022) find a 0.7 - 9.9% mortality risk in the 6 months post-discharge for under-5s hospitalized with malaria and 2.3 - 18.8% for those hospitalized with anemia across several countries in Africa.21
- Okell et al. (2023) estimate that recurrent severe malarial anemia (SMA) post-discharge constitutes 19% of all SMA episodes in moderate-to-high transmission settings, and that the post-discharge children face 18–60 times higher readmission risk than the general population 3–14 weeks later (and 10–36 times 15–25 weeks later).22
We haven’t looked at these papers in detail, but we think their headline results underscore our intuitive impression that the children at risk of dying from infectious disease are a far from random subset each year.
Modeling these drivers
We can put the data from the previous section—both the skewed mortality data and the post-discharge data—into a model which ‘follows’ a cohort of children throughout the ages of 0-5. To estimate the skewness of mortality risk through time, we aggregate the data underlying Figure 3 into one year intervals. To convert the post-discharge outcomes into an assumption about ‘overlap’ in lives saved (i.e., the fraction of children we’re repetitively saving), we make the following assumptions:
- Assume that under-5 children that have just been counterfactually saved by SMC in year 1 are 40 times more likely to die in the next year than the general population. We think this is a reasonably conservative interpretation of the post-discharge papers above—it’s slightly higher than the ratio implied by Kwambai et al. (2023), but in the middle of the range for readmission risk implied by Okell et al. (2023).
- Choose an overlap parameter that ‘solves’ for this skewness in risk ratios. Assuming a 20% overlap between years 1 and 2 (i.e. 20% of the deaths averted in year 2 were also averted in year 1) implies that children counterfactually saved in year 1 are 40x more likely to die in the absence of treatment in year 2 compared to the general population.
With these assumptions in hand, we can build a simple model of repetitive saving and compare this to our current model. We feel very uncertain about this model—for reasons discussed here. We think of this model as an alternative lens to view the question of repetitive saving, which stands alongside the more intuitive arguments outlined here and here, and a sense-check of our conclusions below. This caveat notwithstanding, we still find it useful to ‘put numbers’ on this question and embed the drivers we’ve previously discussed into an overarching quantitative framework.
Figure 5: A simple model of repetitive saving
| Scenario A: current model | Scenario B: worst case | Scenario C: skewed mortality | Scenario D: best guess | |
| Headline parameters | ||||
| Cohort (arbitrary) | 1,000,000 | 1,000,000 | 1,000,000 | 1,000,000 |
| Expected reduction in annual malaria mortality from SMC | 50% | 50% | 50% | 50% |
| Overlap in deaths averted | 0% | 100% | 100% | 20% |
| Probability children die from malaria without treatment | ||||
| Year 1 | 0.50% | 0.50% | 1.13% | 1.13% |
| Year 2 | 0.50% | 0.50% | 0.74% | 0.74% |
| Year 3 | 0.50% | 0.50% | 0.35% | 0.35% |
| Year 4 | 0.50% | 0.50% | 0.18% | 0.18% |
| Year 5 | 0.50% | 0.50% | 0.10% | 0.10% |
| Probability we avert a death given treatment effect | ||||
| Year 1 | 0.25% | 0.25% | 0.57% | 0.57% |
| Year 2 | 0.25% | 0.25% | 0.37% | 0.37% |
| Year 3 | 0.25% | 0.25% | 0.17% | 0.17% |
| Year 4 | 0.25% | 0.25% | 0.09% | 0.09% |
| Year 5 | 0.25% | 0.25% | 0.05% | 0.05% |
| New deaths averted each year given overlap assumption | ||||
| Year 1 | 2,500 | 2,500 | 5,654 | 5,654 |
| Year 2 | 2,500 | 0 | 0 | 2,947 |
| Year 3 | 2,500 | 0 | 0 | 1,388 |
| Year 4 | 2,500 | 0 | 0 | 722 |
| Year 5 | 2,500 | 0 | 0 | 420 |
| Cumulative deaths averted | 12,500 | 2,500 | 5,654 | 11,131 |
| Year 1 | 2,500 | 2,500 | 5,654 | 5,654 |
| Year 2 | 5,000 | 2,500 | 5,654 | 8,601 |
| Year 3 | 7,500 | 2,500 | 5,654 | 9,989 |
| Year 4 | 10,000 | 2,500 | 5,654 | 10,711 |
| Year 5 | 12,500 | 2,500 | 5,654 | 11,131 |
| Implied adjustment | -80% | -55% | -11% | |
Notes: model is outlined here.
Walking through these calculations:
Scenario A: current model
- Assume we treat 1,000,000 children with SMC each year (this number is arbitrary)
- Each year, assume there’s a 0.5% chance children die from malaria (either directly or indirectly) without treatment, and that this risk is constant each year. This corresponds to (roughly) what we currently assume in our SMC CEA.23
- Assume that SMC leads to a 50% reduction in annual malaria mortality. In our CEA, this comes from combining the expected reduction in malaria mortality during the SMC season (79%)24 with the fraction of annual malaria mortality assumed to occur in the SMC season (70%).25 79%*70% = ~50%.26
- With a 0.5% mortality risk and 50% treatment effect, there’s a (0.5%*50% =) 0.25% probability we save a life each year. With a cohort of 1 million children, this amounts to (1M*0.25% =) 2,500 lives each year.
- Since we (implicitly) assume that we save the lives of different sets of children each year, by the end of year 5 we save (2,500*5 =) 12,500 lives in total.
Scenario B: worst case scenario
- In our worst case scenario, we retain our assumptions about the treatment effect and how burden is distributed across the under-5 window. However, we now assume a 100% overlap in lives saved each year—i.e. all the deaths averted in year 2 were the same deaths that were averted in year 1.
- With this assumption, we also save (1M*0.25% =) 2,500 lives in year 1, then save the same 2,500 lives in years 2-5, meaning we save 2,500 lives in total.
Scenario C: skewed mortality only
- In this scenario, we overlay the skewed mortality profile implied by Figure 3 but retain the 100% overlap assumption.
- In year 1, we assume there’s a 1.13% chance that a child dies from malaria, which falls to 0.74% in year 2, 0.35% in year 3, etc. The cumulative risk across the under-5 window remains the same; we just shift how it is distributed across the years. These calculations are outlined here.
- Assuming the same 50% treatment effect, there’s a (1.13%*50% =) 0.57% chance we avert a death in year 1, which corresponds to (1M*0.57% =) 5,700 lives saved.
- With a 100% overlap assumption, we assume the same lives are saved in years 2-5, which means we save 5,700 lives in total.
Scenario D: best guess
- This scenario retains the skewed mortality assumption but lowers the overlap assumption to 20%. In year 1, we save (1M*0.57% =) 5,700 lives. In year 2, we save (1M*0.37% =) 3,700 lives. With a 20% overlap in deaths averted, (3,700*20% =) 740 of these deaths were also averted in year 1. Hence, we avert (3,700-740 =) 2,960 new deaths, and (5,700 + 2,960 =) 8,660 cumulative deaths by year 2.
- This corresponds with the risk ratios implied by the post-discharge papers. For example:
- (740/5,700 =) 13% of the children whose deaths were averted in year 1 would have died in year 2 without treatment.
- (2,960/(1,000,000-5,700) =) 0.3% of the children whose deaths weren’t averted in year 1 would have died in year 2 without treatment. Hence, children whose deaths were averted in year 1 have a (13%/0.3% =) ~40 times greater mortality risk than the general population.27
- In years 3-5, assume mortality risk continues to decline and that there continues to be 20% overlap in lives saved across consecutive years. We make these choices for the sake of simplicity and can think of reasons why they would bias the bottom-line both upwards and downwards:
- On the one hand, holding fixed a 20% overlap assumption generates much more skewed risk ratios in later years compared to what’s implied by the post-discharge papers. For example, with this assumption, children saved in year 3 are 144x more likely to die in year 4 than the general population (calculations here). This makes us think we may be underestimating cumulative lives saved.
- On the other hand, in our model, risk only persists for 1 year. For example, if a child was counterfactually saved from dying in year 1, their risk of dying is elevated in year 2 but not in year 3 and onwards. This makes us think we could be overestimating cumulative lives saved, since we’d expect risk to persist for more than one year.
- We don’t have a good sense of which source of bias is likely to outweigh the other, so we make the simplifying assumption that these ‘cancel out’.
- When we roll these assumptions forward, we estimate 11,100 cumulative lives saved—around 10% fewer compared to our current assumptions. Figure 6 illustrates how our best guess of the pattern of lives saved across time—with skewed mortality risk and an assumption of persistence across years—compares to our status quo estimate and our previously considered ‘worst case’ scenario.
Figure 6: Illustrated scenarios
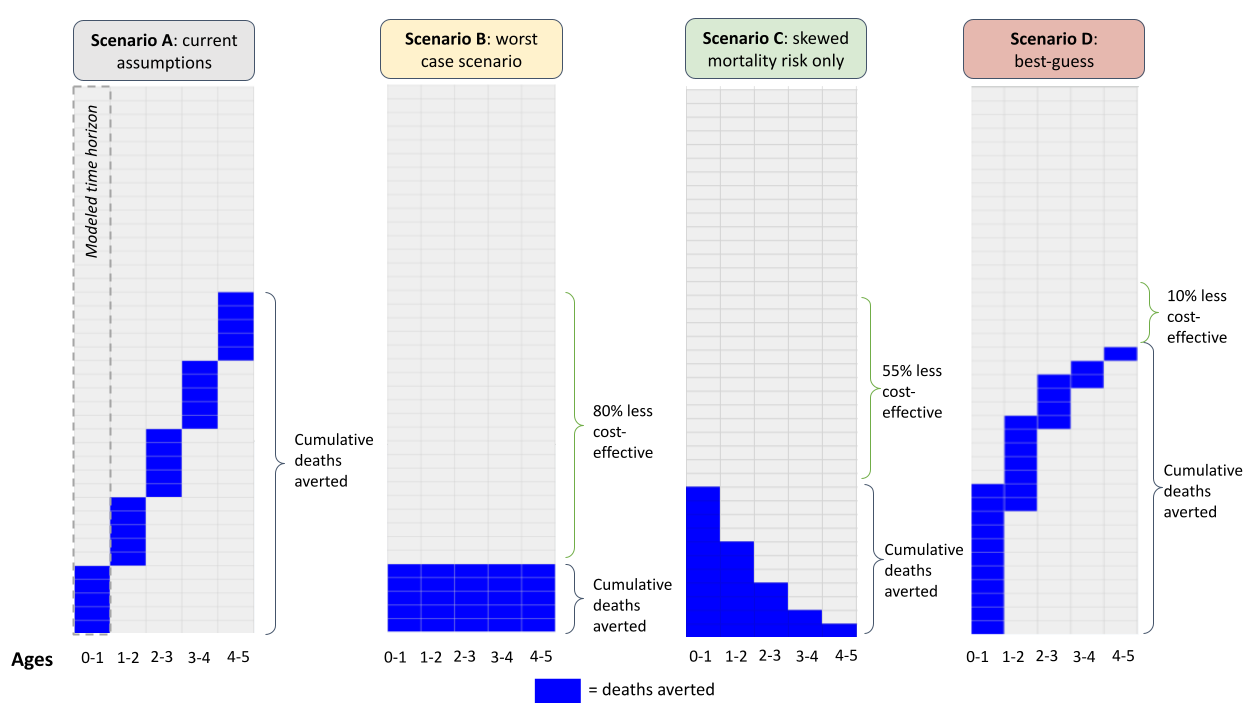
Notes: the model that generates these scenarios is outlined here.
Sensitivity checks
To check the sensitivity of our model to different assumptions, Figure 7 outlines some sensitivity tables which tweak key assumptions. In summary, the model isn’t sensitive to what we assume about the SMC treatment effect (since this just causes relative shifts), is only mildly sensitive to whether we use the age-disaggregated burden estimate of Carneiro et al. (2010) compared to IHME data, but is pretty sensitive to what we assume about overlap in lives saved. If we assume a 40% overlap in lives saved—our 75th-percentile guess—cumulative lives saved falls to 9,800. This is a (9,800/12,500 =) 22% downwards adjustment. The sensitivity of the bottom line matches our qualitative impression that this parameter is the one we feel most unsure about, and the one most likely to influence our conclusion.
Figure 7: Repetitive saving model sensitivity tables
Test A: smaller treatment effect
| Current model | Worst-case scenario | Best guess | |
| Headline parameters | |||
| Burden estimate | IHME (flat) | Carneiro et al. | IHME (skewed) |
| Expected reduction in annual malaria mortality from SMC | 25% | 25% | 25% |
| Overlap in deaths averted | 0% | 20% | 20% |
| New deaths averted each year given overlap assumption | |||
| Year 1 | 1,250 | 1,250 | 2,827 |
| Year 2 | 1,250 | 0 | 1,474 |
| Year 3 | 1,250 | 0 | 694 |
| Year 4 | 1,250 | 0 | 361 |
| Year 5 | 1,250 | 0 | 210 |
| Cumulative deaths averted | 6,250 | 1,250 | 5,565 |
| Implied adjustment | -80% | -11% | |
Test B: Carneiro et al. vs. IHME burden estimate
| Current model | IHME burden | Carneiro et al. burden | |
| Headline parameters | |||
| Burden estimate | IHME (flat) | IHME (skewed) | Carneiro et al. |
| Expected reduction in annual malaria mortality from SMC | 50% | 50% | 50% |
| Overlap in deaths averted | 0% | 20% | 20% |
| New deaths averted each year given overlap assumption | |||
| Year 1 | 2,500 | 3,729 | 5,654 |
| Year 2 | 2,500 | 2,196 | 2,947 |
| Year 3 | 2,500 | 2,800 | 1,388 |
| Year 4 | 2,500 | 1,867 | 722 |
| Year 5 | 2,500 | 153 | 420 |
| Cumulative deaths averted | 12,500 | 10,746 | 11,131 |
| Implied adjustment | -14% | -11% | |
Test C: Best guess vs. 75th percentile overlap assumption
| Current model | Bigger overlap | Best guess | |
| Headline parameters | |||
| Burden estimate | IHME (flat) | Carneiro et al. | Carneiro et al. |
| Expected reduction in annual malaria mortality from SMC | 50% | 50% | 50% |
| Overlap in deaths averted | 0% | 40% | 20% |
| New deaths averted each year given overlap assumption | |||
| Year 1 | 2,500 | 5,654 | 5,654 |
| Year 2 | 2,500 | 2,210 | 2,947 |
| Year 3 | 2,500 | 1,041 | 1,388 |
| Year 4 | 2,500 | 542 | 722 |
| Year 5 | 2,500 | 315 | 420 |
| Cumulative deaths averted | 12,500 | 9,761 | 11,131 |
| Implied adjustment | -22% | -11% | |
Outside the model checks
We take the bottom line of our model as a weak vote against repetitive saving being a big concern, but we don’t put a lot of stock in it given speculative choices we’ve had to make about parameter values, model structure, and the appropriate proxy (discussed in more detail here).
To further stress-test this conclusion, we also looked at the pattern of results in the experimental trials of SMC (and prophylaxis programs more generally) to see if we could spot any telltale signs of repetitive saving being a larger concern. For example, if we were averting the same deaths each year, we’d expect to see survival differences between treatment and control groups fade out if treatment is prematurely withdrawn within the under-5 window.
This possibility is discussed in a recent World Health Organization report on the ‘malaria rebound phenomenon’, which asks whether severe malaria events spike after prophylaxis programs are withdrawn. The papers underpinning this report are summarized below—those highlighted in bold seem especially relevant, since they provided prophylaxis treatment for an incomplete slice of the under-5 window.
Figure 8: Summary of malaria rebound effect papers
Location |
Type of intervention |
Age of treated |
Duration of intervention |
Duration of follow-up |
Rebound? |
|||||||
| Malaria incidence | Severe malaria | Hospital- izations |
Mortality |
|||||||||
| Bradley-Moore 1995 | Nigeria | Chemo- prophylaxis |
0-2 years | 1 or 2 years | 6 months |
No |
No |
|||||
| Greenwood 1988 | The Gambia | Chemo- prophylaxis |
3-59 mos | 9 months | 12 months |
No |
No |
|||||
| Menon-Greenwood 1990 | The Gambia | Chemo- prophylaxis |
3-59 mos | 2-5 years | 2-7 years |
Not significant |
No or not sig |
|||||
| Aponte 2007 | Tanzania | Chemo- prophylaxis |
2-12 mos | 10 months | 3 years |
Yes |
Not significant |
Not significant |
||||
| Guinovart 2012 | Mozambique | Chemo- prophylaxis |
2-9 mos | 3-5 months | 14 months |
Not significant |
Not significant |
No |
||||
| Bigira 2014 | Uganda | Chemo- prophylaxis |
6-24 mos | 18 months | 12 months |
Not significant |
No |
Yes |
||||
| Kamya 2014 | Uganda | Chemo- prophylaxis |
6-24 mos | 18 months | 12 months |
No |
No |
No |
||||
| Chandramohan 2005 | Ghana | IPTi | 2-12 mos | 10 months | 8 months |
Yes |
No |
No |
||||
| Kobbe 2007 | Ghana | IPTi | 3-15 mos | 12 months | 3 years |
No |
Not significant |
No |
||||
| Mockenhaupt 2007 | Ghana | IPTi | 3-15 mos | 12 months | 9 months |
No |
No |
No |
||||
| Kweku 2008 | Ghana | SMC | 3-59 mos | 6 months | 12 months |
Not significant |
No or not sig |
No |
||||
| Dicko 2011 | Mali | SMC | 3-59 mos | 2 months | 12 months |
No or not sig |
No |
Not significant |
||||
| Konate 2011 | Burkina Faso | SMC | 3-59 mos | 3 months | 12 months |
Yes |
No |
|||||
Though we didn’t read these papers in detail, in general it looks as though most of them did not find evidence of a rebound in severe malaria events (e.g. hospitalizations and death) after treatment was withdrawn. This seems in keeping with the general tone of the WHO report, which states: “although the available evidence suggests that rebound is a real, measurable phenomenon, evaluations have shown that the extent of the rebound has not outweighed the benefits of the intervention, and it does not appear to be of a frequency or magnitude to warrant serious concern about current interventions”.28 We take this as an additional vote against repetitive saving being a big concern, but we don’t put much weight in this sense-check, because the results are spotty and many of these studies appear underpowered to detect rebound in severe events.29
How could we be wrong?
Our bottom line is that we don’t think repetitive saving is a big concern in the context of our top charities. There are a number of ways this conclusion could be wrong:
Modeling uncertainties
- This conclusion is at least partly based on the outcome of our model, which we feel uncertain about for three main reasons:
- Uncertainty about the proxy: we use the survival prospects of post-discharge children to proxy the survival prospects of children counterfactually saved via SMC treatment. However, we can think of reasons why the survival prospects of these children could be both better or worse, and we don’t have a good sense of which one is likely to dominate:
- On the one hand, if surviving a severe bout of malaria confers some lasting immunity, these children may have better survival prospects than the cohort we’re interested in.
- On the other hand, if severe malaria has scarring effects, or if these children are discharged before they’re fully recovered, they may have worse survival prospects than the cohort we’re interested in.
- Parameter choices: even if we buy the proxy, we have to make a number of choices to ‘convert’ the survival prospects into an overlap/persistence parameter. We think our choices skew conservative, because assuming a 20% overlap parameter each year implies larger risk ratios in later years than what’s implied by the post-discharge papers.
- Modeling choices: we make the assumption that heightened mortality risk only persists for a year after death is counterfactually averted. This strikes us as not conservative enough, which we assume cancels out the more conservative parameter choices, but we’re very uncertain about this
- Uncertainty about the proxy: we use the survival prospects of post-discharge children to proxy the survival prospects of children counterfactually saved via SMC treatment. However, we can think of reasons why the survival prospects of these children could be both better or worse, and we don’t have a good sense of which one is likely to dominate:
General uncertainties
- How repetitive treatment interacts with the acquisition of natural immunity. One reason to think repetitive saving is a bigger concern is if the repetitive provision of preventative treatment delays naturally acquired immunity (NAI). If so, we’d feel more concerned about repetitive saving, since it would weaken our story about early treatment rounds getting children through a narrow window of risk. In other words, the first round of SMC may just ‘shift’ the hump rather than ‘getting children over’ the hump. We feel uncertain about this, but don’t think it’s likely to be a big concern because:
- According to David Dowdy, there’s an age-vulnerability gradient that isn’t dependent on NAI.30 Concretely, a 4-year-old (or 14-year-old) with no NAI is still less likely to die from a malaria infection compared to a 1-year-old with no NAI.
- If all SMC did was shift the hump rather than get children through the hump, we’d expect to see a rebound in severe malaria events once treatment is withdrawn. As this section shows, we don’t clearly see this
Are we returning children to normal life expectancy?
This question of repetitive saving appears very related to the question of whether we’re returning children to normal life expectancy once treatment ends, as our models currently assume. In fact, we think these are fundamentally the same question—the reason we worry about repetitive saving is because we worry that our programs may only be extending life expectancy by a year, and so we may be saving the same lives with each round of treatment. The only difference is that this question extends the time horizon—rather than looking at life expectancy within the under-5 window, this question asks whether it’s reasonable to assume that we return children to normal life expectancy once we’ve gotten them through the under-5 window.
Though we’ve thought less about this, our initial guess is that further investigation is unlikely to lead to big changes in our grantmaking, because we think the same fundamental drivers apply. First, when we extend the time horizon to adulthood, mortality risk from infectious diseases (and all-causes) remains very skewed towards the early years, which we think generally supports the idea that if we can get children through this critical period, they should have a good chance of surviving until adulthood (more). Second, long-run follow-ups of childhood net programs find that early life survival benefits persist until late childhood/early adulthood. We view this as a vote against high persistence of mortality risk, or the idea that children whose deaths are averted by net use are systematically more likely to die after age 5 (more).
Thinking about time horizons beyond the under-5 window also brings difficult moral questions to the surface. We’re not sure we would want to take into account post-treatment life expectancy even if we weren’t convinced by the empirical argument, because we’d worry about implicitly viewing lives lived in more deprived contexts as less valuable. We also think it’d take our moral weights—what we use to assign value to averting deaths—further away from more standard measures we might use, such as disability-adjusted life years (DALYs) or years of life lost from mortality (YLLs).31
Driver 1: Skewness of mortality risk across the life cycle
Based on 2019 IHME data in Nigeria, mortality risk from infectious diseases (and all-cause mortality) seems heavily skewed towards the early years. This jibes with our general understanding of the literature on early childhood development, which points to the early years (or first 1,000 days) as being the most crucial for the development of the brain, body, metabolism and immune system.32 We think this supports the general idea that if we can get children through this critical window, they should have a reasonable chance of surviving to adulthood as their bodies become more robust at fighting infectious disease (and other causes of death).
Figure 9: Distribution of deaths across the life cycle, Nigeria 2019
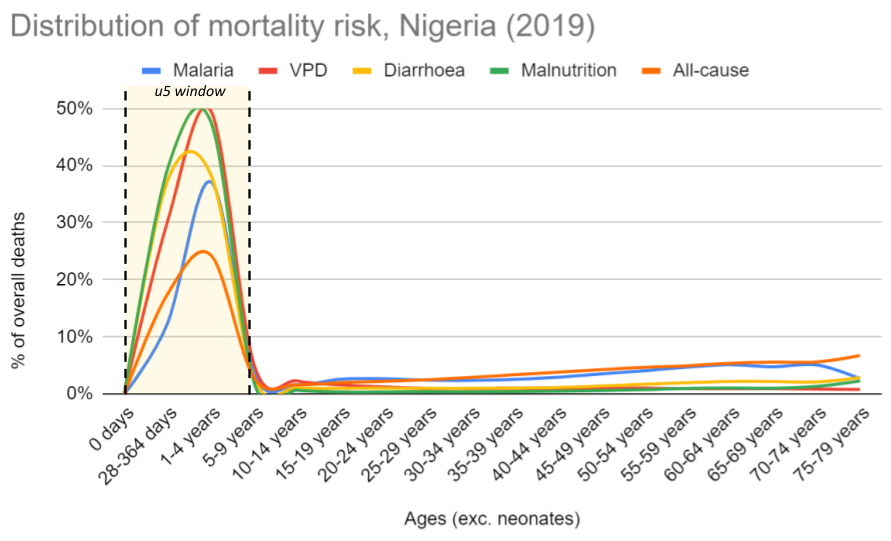
Notes: Data from 2019 IHME. Neonates are excluded because our top charities don’t target neonates, and including these would skew the data even further towards early life. See calculations here.
Driver 2: Persistence of the at-risk population
If the children being counterfactually saved by our interventions had a persistently higher mortality risk post-treatment, we’d expect to see initial survival differences between treatment and control groups fade out over time, as children saved from malaria deaths in early childhood would be more likely to die from malaria (or other diseases) in later childhood.
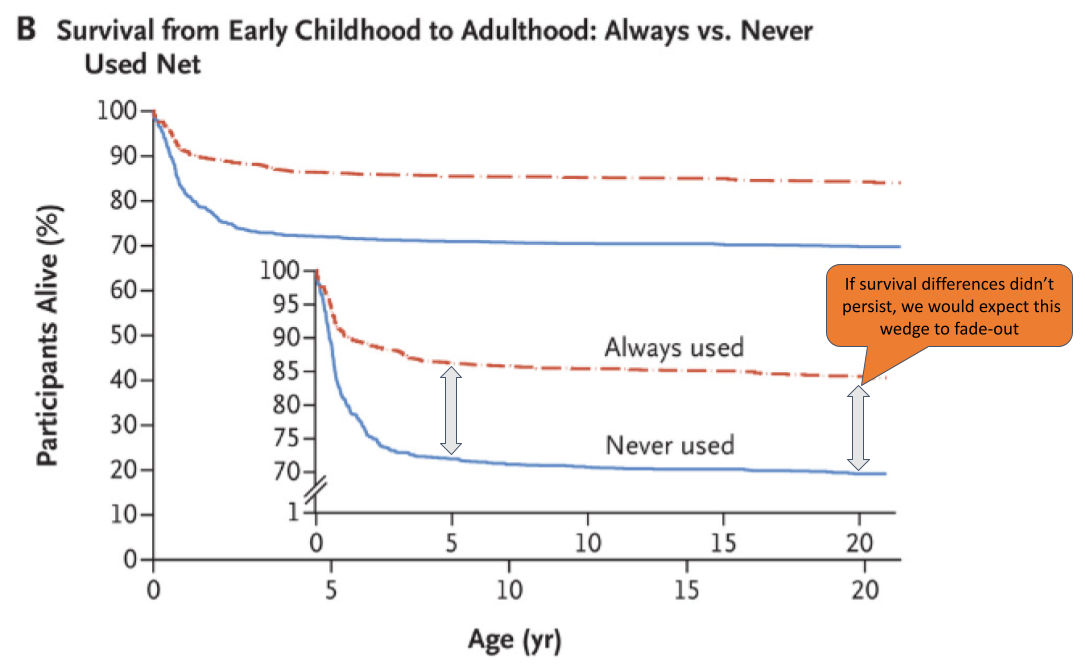
A basic empirical challenge we face in probing this is that, as far as know, there are no long-run (i.e. >5 year) follow-ups of the trials we use to establish the mortality effects of SMC or VAS.33 However, there are some for nets: we found 6 studies which followed children for >5 years after early life net use. Of these, the study with the longest follow-up window was Fink et al. (2022), which followed children for 22 years.34 This paper found persistent survival benefits of early life net usage – as Figure 8 shows, ~85% of children that always used nets in early life survived until age 22, compared to ~70% of children that never used nets. This 15 percentage point wedge is very similar to the initial wedge that emerged after net use in early life. After controlling for covariates, the hazard ratio of participants who were reported to have used treated nets at half the early-life visits was 0.93 (95% CI, 0.58 to 1.49) between the ages of 5 and 22, compared those who were reported to have used treated nets at less than half the visits.35 For this to raise alarm bells, we would have to have seen a hazard ratio of >1, since this would imply early life net usage was associated with more mortality between the ages of 5-22 than no net usage (i.e. a shifting of the initial mortality effect). We take this as evidence against this happening, although a major limitation of this study is that the design is non-randomized.36 Even after controlling for covariates, there may be other reasons why children in families that opted into early life net usage might be more likely to survive.37
Figure 10: Survival curves from Fink et al. (2022)
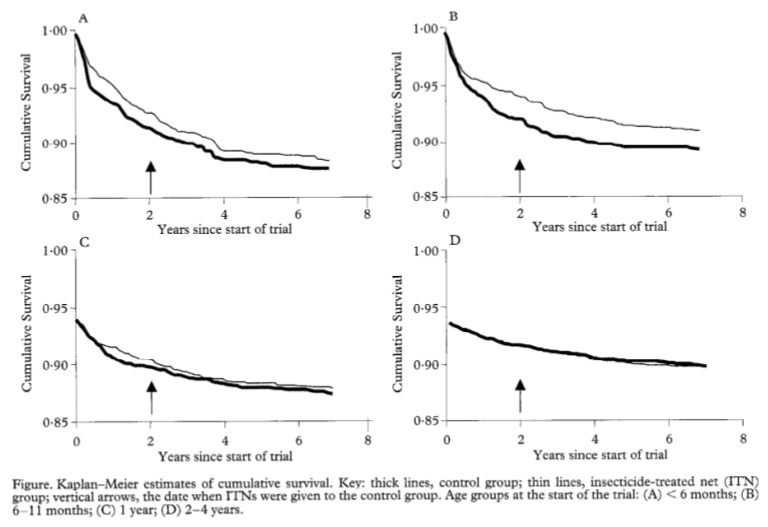
This finding is consistent with 5 other studies, which followed children for the first 6-10 years of life. Unlike Fink et al. (2022), these papers were based on randomized designs—all of them followed up on cluster randomized controlled trials, where the control group received nets 6 months to 2 years after the treatment group.38 Based on a light review of these papers, none of them find evidence to suggest that initial reductions in mortality in early life were compromised by a shift in mortality to older-age children.39 We find the survival curves of one study (Binka et al. 2002) interesting for two reasons – first, in Panels A and B, the wedge between survival curves in year 2 seems broadly similar to the wedge in year 7, similar to the findings of Fink et al. (2022). Second, in Panels C and D—which are estimated on older children—the survival curves of the treatment and control group are very similar, which we think provides further evidence for the idea that the mortality benefits of preventative malaria programs are skewed towards the early years (as argued here). A general limitation of these 5 trials is that none of them follow up on children until adulthood—meaning they can’t directly answer this question—and the relatively short delay in net access between treatment and control groups may mean they’re underpowered to detect later-life mortality.40
Figure 11: Survival curves from Binka et al. (2002)
Overall, we view this as suggestive evidence that premature death after our childhood health programs end isn’t a big concern. If we were to look into this further, we might look for long-run follow-ups of other child health programs outside our top charities, such as under-5 tuberculosis prophylaxis campaigns.41 We might also try to build a model—similar to the one we built for repetitive saving—that attempts to bound this issue, or flesh out exactly what we’d need to believe for us to potentially reconsider our allocations to child health programs. However, before embarking on these next steps, we’d want to think more about the moral question of whether life expectancy within age-cohorts is something we ought to account for when assigning a value to averting a child's death.
Moral difficulties raised by the life expectancy question
Currently, we assign a value to this via our ‘moral weights’, which attach quantitative values to different outcomes that we care about (e.g. averting deaths, improving income). Our moral weights are based on a combination of staff, donor, and beneficiary preferences.42 In the past, we’ve considered using alternative ways to assign value to averting deaths such as DALYs.43
Both our moral weights and DALYs take life expectancy across age-cohorts into account—for example, both value averting the death of a 5-year-old more highly than averting the death of a 50-year-old,44 since the 5-year-old can expect to have more years of life ahead of them.45 However, neither metric takes into account life expectancy within age-cohorts—for example, by estimating whether 5-year-olds that are counterfactually saved from malaria death have lower life expectancy compared to the average 5-year-old. To estimate what’s ‘lost’ when a child dies from malaria, both our moral weights and DALYs assume that if they hadn’t died prematurely, they would have gone on to live to an average life expectancy.46
Even if we thought this was a bad empirical assumption, we think accounting for life expectancy within age cohorts would force difficult ethical trade-offs to the surface. On the one hand, it feels reasonably intuitive to us that if our SMC program was just delaying malaria deaths from age 1 to age 2, this should ‘count’ for less compared to a program that was returning them to average life expectancy. On the other hand, we’d worry that taking into account life expectancy within age cohorts might lead us to assume that infant deaths averted in Sweden are more valuable than those averted in Burkina Faso, since we might expect children in Sweden to live longer anyway.47 We find this conclusion uncomfortable, since it stands at odds with other intuitions we hold about not wanting to ‘double-penalize’ children living in the most deprived conditions.48
In sum, we think accounting for life expectancy within age cohorts would embed ambiguous moral choices and move our moral weights further away from standard measures used in the global health community (e.g. DALYs). We think this raises the bar that the empirical argument would have to meet for us to seriously consider doing this. At the moment, we don’t think this bar is met, since we think both the long-run follow-ups of net studies and the skewness of mortality data in LMICs lend weight to the idea that, if we can get children through a vulnerable window in early life, they should have a reasonably good chance of surviving until adulthood. We may revisit this question in future, but if we were to do so, we would likely start by reconsidering the moral implications of accounting for life expectancy within age cohorts before doing more empirical research.
Forecasts
| Confidence | Prediction | By time |
|---|---|---|
| 30% | We will decide to conduct additional research on this topic. | By December 2026 |
| 20% | Conditional on conducting additional research, we will decide to make a negative quantitative update of 20% or more to account for this issue in our top charities. | By December 2026 |
Sources
- 1
In our SMC CEA, we inflate the annual malaria mortality risk by 75% to account for ‘indirect deaths’—i.e. deaths indirectly caused by malaria (e.g. through a weakening of the immune system) but attributed to other causes (e.g. diarrhea). See the indirect deaths section of our SMC report for more details.
- 2
See this row of our SMC CEA, which uses an annual malaria mortality rate among 3-59 month olds. This implicitly assumes a flat mortality profile across this age range.
- 3
This estimate is derived from combining our estimate of the expected reduction in malaria mortality among children under age 5 receiving SMC (79%) with our estimate of the share of annual malaria deaths occurring in the SMC season (70%). (79%*70%) ~= 50%. Note that this 50% estimate applies to countries within the Sahel region of Africa only.
- 4
Professor Berkley flagged the possibility of repeatedly saving the same lives between the 0-1 year and 1-2 year window, because mortality risk is still high in the second year of life. Jay Berkley, email to GiveWell April 19, 2024 (unpublished).
- 5
At the start of this project, we did a literature search to see if anyone had written papers on repetitive saving in the context of SMC, or repetitive childhood prevention programs more generally. We couldn’t find anything that directly addressed this question, though it’s possible we missed something.
- 6
For SMC and VAS, we model cost-effectiveness over a 1-year time horizon, though children in theory receive SMC and VAS each year between the ages of 0 and 5. For nets, we model cost-effectiveness over the life cycle of a net—assumed to last ~2 years—and hence children could be ‘treated’ with nets multiple times in the under-5 window.
- 7
In this tab, we outline data on the under-5 mortality profile on the causes of death that our top charities target. All appear skewed towards early life.
- 8
“I think in a high malaria transmission setting, children either die or become immune very quickly. So you'll only save a life once. But what will happen is you keep giving the intervention, but it won't be helpful because the child is already immune.” Call with Jay Berkley, October 23, 2023 (unpublished).
“I think recurrent ‘saving’ is likely to be true for many conditions, but I see this essentially as tiding children over until they are old enough to have a very low risk of death. In the range from birth to 5y, deaths are very concentrated in the early months, with very few deaths after 2y in most community surveys.” Jay Berkley, email to GiveWell October 10, 2023 (unpublished).
“I agree with this 100%. But one could then argue that one should focus not on u5, but rather only on u2 or u1.” David Dowdy, comment on a previous draft of this page.
- 9
There may be practical or ethical reasons why it may not be possible to fund more age-targeted SMC campaigns. We leave these questions to one side in this report.
- 10
“This [the repetitive saving issue] will vary by disease entity. What you need to think about is the persistence of the at-risk population through time.”, Call with David Dowdy, December 15 2023 (unpublished). Note that this quote is not verbatim and is instead copied from rough notes taken during the call.
- 11
“Males are typically 3 times more likely to be killed in road crashes than females”, World Health Organization, Road traffic injuries, 2023.
- 12
This makes us unconcerned about repetitive saving even though there’s not a narrow window of risk (of road traffic accidents) that Zusha pushes people through. Road traffic deaths don’t seem confined to a narrow age window.
- 13
“Type 1 diabetes is thought to be caused primarily by genetic components”, Healthline, "Is Type 1 Diabetes Genetic?"
- 14
“No cure for type 1 diabetes currently exists”, Healthline, "Is There a Cure for Type 1 Diabetes?"
- 15
“Sickle cell trait has repeatedly been identified as a major human malaria resistance factor”, Archer et al. (2018)
- 16
“Low SES is shown to be an important risk factor for infectious disease, part of which may be mediated by poor lifestyle and chronic comorbidities”, Ye et al. (2023), page 1
- 17
“Absolute mobility and relative mobility are lower in developing economies than in high-income economies”, World Bank, "Fair Progress? Economic Mobility across Generations Around the World" (2018), page 6. We think the persistence of poverty also underpins the idea of poverty traps, as discussed in this paper.
- 18
“Several studies found that febrile malaria hotspots are positively correlated over time, but temporally unstable, i.e. they change location over time after some years. The studies have somewhat conflicting results on the extent of serial correlation of febrile malaria in hotspots over time (Bejon et al., 2010; Mogeni et al., 2017; Platt et al., 2017; more detail in Appendix B)”, Rethink Priorities, Serial Correlation in Lives Saved and Rebound Deaths, unpublished report. To request access to this report, please fill in this access request form.
- 19
“Cumulative post-discharge mortality among the 3,538 children discharged alive was 4.9%, 6.2%, and 9.3% by 3, 6, and 12 months after discharge, respectively,” Kwambai et al. (2023), page 2
- 20
See, for example, our all-cause under-5 mortality estimate for Kenya in our VAS model, which excludes neonates.
- 21
“A meta-analysis of mortality after discharge from 20 studies showed that the crude risk of all-cause mortality after discharge by 6 months ranged from 2·3% to 18·8% for severe anemia… and 0·7% to 9·9% for malaria”, Kwambai et al. (2022), page 5
- 22
“We estimate that recurrent SMA post-discharge constitutes 19% of all SMA episodes in moderate-to-high transmission settings… The incidence of hospitalized malaria was strikingly high in the post-discharge placebo group compared to the average in the general population of the same age estimated in other studies, being 18–60 times higher during post-discharge weeks 3–14 in settings with parasite prevalence>10%, and still 10–36 fold higher in weeks 15–25”, Okell et al. (2023), page 1
- 23
See line 52 of our SMC CEA. This is based on the annual malaria mortality rate among 3-59 month olds (line 50), which implicitly assumes a flat mortality profile across this age range.
- 24
See line 49 of our SMC CEA.
- 25
See line 54 of our SMC CEA.
- 26
Note that this 50% estimate applies to countries within the Sahel region of Africa only.
- 27
The fact that low overlap in lives saved can coexist with extremely skewed risk ratios was surprising to us at first, but we think it makes sense given that deaths are such a rare event. Because of this, you can drastically shrink the at-risk population (or: the ‘urn’ from which you think you’re drawing from each year) and it will still be relatively unlikely that you’re saving the same lives.
- 28
- World Health Organization, Technical consultation on the malaria rebound phenomenon, 2022, p. v.
- We have added italics to a part of this quote for emphasis.
- 29
“In general, the number of severe events in these studies was small, and the studies were not powered to detect rebound”, World Health Organization, Technical consultation on the malaria rebound phenomenon, 2022, p. 4.
- 30
“Even if you just shift malaria infection to age 3, people could be less likely to die because their bodies are more robust etc.”, Call with David Dowdy, December 15 2023 (unpublished). Note that this quote is not verbatim and is instead copied from rough notes taken during the call.
- 31
These measures are commonly used in the public health community and other cost-effectiveness analyses. DALYs were developed in the 1990s as a way to measure the burden of different diseases. They’re based on combining two measures: years lived with disability (YLDs) and years of life lost due to mortality (YLLs). DALYs = YLDs + YLLs. Before DALYs, the overall burden (or severity) of a specific disease was often calculated by totaling the number of people that died from the disease. DALYs were developed to address two shortcomings with this approach: it didn’t take into account disability (i.e. some diseases make people’s life worse without killing them) and it didn’t take into account the fact that some diseases (e.g. malaria) tend to kill people that are much younger than other diseases (e.g. stroke). Other cost-effectiveness analyses in public health often use DALYs as the ‘currency’ to quantify the benefits—e.g., the number of DALYs averted. See, for example, this summary article, which tries to estimate cost-effectiveness thresholds using DALYs.
- 32
“A person's first 1,000 days, or the period from conception to age two, are the most crucial for the development of their body, brain, metabolism, and immune system”, Likhar and Patil (2022), page 1.
- 33
This understanding is based on a quick literature review and our internal knowledge of the evidence base behind these programs.
- 34
“We used data from a 22-year prospective cohort study in rural southern Tanzania to estimate the association between early-life use of treated nets and survival to adulthood”, Fink et al. (2022), page 1.
- 35
“Participants who were reported to have used treated nets at half the early-life visits or more had a hazard ratio for death of 0.57 (95% confidence interval [CI], 0.45 to 0.72) as compared with those who were reported to have used treated nets at less than half the visits. The corresponding hazard ratio between 5 years of age and adulthood was 0.93 (95% CI, 0.58 to 1.49)”, Fink et al. (2022), page 1.
- 36
The study is a prospective cohort study, which follows groups of individuals over time who are alike in many ways but differ by a certain characteristic (e.g. whether they used nets in early childhood).
- 37
“Even though our models included a substantial number of covariates, residual confounding cannot be ruled out”, Fink et al. (2022), page 10. One example of a confounding factor would be if families that opted in to early net usage also opted into better health investments later down the line (e.g. improved diets, more health clinic visits).
- 38
“All of them have relatively similar experimental designs in that they are based on cluster-RCTs in which the treatment group receives bed nets at the beginning of the trial, and the control group receives bed nets at a later point (e.g. 6 months or 2 years later)”, Rethink Priorities, Serial Correlation in Lives Saved and Rebound Deaths, unpublished report. To request access to this report, please fill in this access request form.
- 39
- “Over the period of our study we found no evidence of a shift over time in mortality from younger to older children, which might have indicated that the effect of ITC was to delay rather than prevent child mortality”, Diallo et al. (2004), page 6
- “A follow-up until the end of 2000 found no indication in any age group of increased mortality in the ITN group after the end of the randomized intervention”, Binka et al. (2002), page 1
- “After the program was stopped after four years, no rebound in all-cause mortality above pre intervention levels was detected among children 1–4 years old who had previously been protected by the intervention, presumably since birth”, Eisele et al. (2005), page 6
- “ITN protection in early infancy is not a risk factor for mortality at older ages”, Louis et al. (2012), page 7
- “Mortality rates did not differ during 2002 (after up to 6 years of bednet use) between children from former intervention and former control households born during phase 1 (HR, 1.01; 95% CI, 0.86-1.19)... There is no evidence that bednet use from birth increases all-cause mortality in older children in an area of intense perennial transmission of malaria”, Lindblade et al. (2004), page 1
- 40
Put simply, if there’s not much difference in the treatment status of treatment and control groups, then any differences in outcomes attributable to that treatment become harder to detect.
- 41
For instance, this meta-analysis of isoniazid prophylactic therapy (to tuberculosis in children) includes a trial with a 10 year follow-up in France. At face-value, the fact that this trial reported a relatively large treatment effect (RR = 0.4) also seems supportive of the idea of persistent survival benefits (we’d expect an RR of close to 1 if early childhood survival faded out). But we haven’t properly interrogated these papers, and would likely do so only if we chose to dive deeper.
- 42
We place 60% weight on donor responses, 10% weight on GiveWell staff preferences, and 30% weight on years of life lost (YLL) from mortality (which we use to proxy the results of the beneficiary survey—an IDinsight study we funded on the preferences of people who are demographically similar to the people served by our recommended programs). See page 7 of our 2020 update on moral weights for more details.
- 43
See page 4 of our 2020 update on our moral weights for a brief discussion of the advantages and disadvantages we foresee with using DALYs.
- 44
See page 9 of our 2020 update on moral weights to see how our moral weight for deaths averted varies by age.
- 45
“DALYs for a specific cause are calculated as the sum of the years of life lost due to premature mortality (YLLs) from that cause and the years of years of healthy life lost due to disability (YLDs) for people living in states of less than good health resulting from the specific cause”, World Health Organization, Disability-adjusted life years (DALYs).
“The total number of deaths from specific causes does not provide a good metric for informing public health priorities. Such a measure, for example, assigns the same weight to a death at age 80 as it does at age 30 or even at 1 year of age. Years of life lost (YLL) is a measure of premature mortality that takes into account both the frequency of deaths and the age at which it occurs.” World Health Organization, Years of life lost from mortality (YLL) .
- 46
In our case, we use average life expectancy in Kenya as a benchmark, which we use as a representative low/middle-income country.
The DALY measure, being based on YLLs, uses a global benchmark of life expectancy based on world population forecasts. From WHO: “The YLLs for a cause are calculated as the number of cause-specific deaths multiplied by a loss function specifying the years lost for deaths as a function of the age at which death occurs. The loss function is based on the frontier national life expectancy projected for the year 2050 by the World Population Prospects 2012 (UN Population Division, 2013), with a life expectancy at birth of 92 years”, (emphasis ours). World Health Organization, Disability-adjusted life years (DALYs). - 47
For example, in 2020, life expectancy was 82 years in Sweden, 70 years in India, and 63 years in Burkina Faso.
- 48
Put another way, if we took context-specific life expectancy into account, we think this would bake in a pretty extreme indifference to equity. We’d assign a higher weight to saving richer, healthier children.