In a nutshell
Community-based tuberculosis (TB) household contact management programs involve health workers visiting households of people who have been diagnosed with TB to screen their close contacts and provide preventive medication where appropriate. These programs are intended to increase uptake of preventive medication among people at high risk of developing TB, while also increasing detection of contacts who already have TB disease.
The program we model here focuses on reaching household contacts aged under 5. It is also a version of the program where an implementer provides technical assistance to support existing health workers to deliver the program, as well as providing some direct financing of procurement and delivery costs. Our best guess is that this version of the program is around our current bar for cost-effectiveness, because:
- it is targeted towards a part of the population at relatively high risk of developing TB disease and dying as a result of it not being treated
- there’s evidence that tuberculosis preventive therapy (TPT) substantially reduces the risk of TB infections progressing to TB disease
- short-course TPT drugs are now relatively cheap, and the costs of implementing a community-based approach to increase TPT usage could be low if health workers are already available to conduct household visits
- there may be substantial longer-term benefits from averting cases of TB disease in childhood, such as improved health later in life and higher incomes
Our main reservations are that:
- we may be overestimating the increase in TPT coverage that can be achieved using a community-based approach, or underestimating the opportunity costs of relying on existing health workers to implement the approach
- there are several channels through which we could be overestimating the number of deaths averted by increasing TPT coverage for household contacts aged under 5, and some of these (such as the case fatality rate for untreated cases of TB) will be difficult to learn more about over time
- we are highly uncertain about the magnitude of the longer-term benefits from averting TB disease, and these account for over a quarter of estimated benefits
Published: September 2024
Table of Contents
- In a nutshell
- Summary
- What is the program?
-
Is the program cost-effective?
- What do we estimate?
-
How do we reach our estimate?
- The risk of tuberculosis disease and death for under-5 household contacts
- The effectiveness of TPT for household contacts under 5
- The increase in treatment coverage generated by a community-based approach
- The cost of buying TPT drugs and implementing a community-based program
- Additional benefits of preventing TB in early childhood
- Other considerations impacting cost-effectiveness
- Is there room for more funding?
- Our process
- Sources
Summary
What does this program do?
Tuberculosis (TB) is a leading cause of death in low- and middle-income countries. (more)
Community-based household contact management (HCM) programs involve health workers visiting households of people diagnosed with TB and screening their close contacts for possible TB. Those with symptoms of TB disease are referred for diagnosis and treatment at existing facilities, while those without signs of TB disease are given TPT, which reduces the risk that they will develop TB disease. (more)
The version of the program we focus on here targets household contacts under 5 years of age, since they are at relatively high risk of progressing to TB disease and less likely to be treated for it. (more)
We believe there’s a strong intuitive case that visiting households to screen contacts and provide TPT can increase coverage rates relative to a facility-based approach, and this is supported by recent evidence. It also seems plausible that this program can increase detection and treatment of active TB disease via referrals to facilities for household contacts with signs of TB. (more)
How cost-effective is it?
We think that community-based HCM programs for TB are cost-effective in contexts where facility-based HCMs generate low TPT coverage rates and where TB treatment rates for young children are relatively low. As of August 2024, we estimate that a program focused on under-5 contacts in large Indian states is around our current bar for cost-effectiveness (i.e. 10 times as cost-effective as cash transfers). (more)
We think this version of the program is cost-effective because:
- It’s targeted at a segment of the population at high risk of dying from a disease which accounts for a large share of deaths in the general population. TB accounts for more deaths globally than either malaria or HIV/AIDS. The household contacts of pulmonary TB patients face much higher risk of being infected with TB and developing TB disease than individuals in the general population, even in high-burden settings. Moreover, children who develop TB disease are less likely to receive treatment than adults, given challenges in detecting pediatric TB. We estimate that roughly a third of children with untreated TB disease will die. (more)
- Tuberculosis preventive therapy (TPT) seems to substantially reduce the risk of a TB infection progressing to TB disease. Two academic meta-analyses suggest that TPT reduces the risk of TB disease developing by at least 50% in child contacts with signs of a TB infection. More recent short-course TPT formulations may be even more effective in the real world by reducing the duration and frequency of drug administration (thus improving adherence) and by being more likely to clear the underlying infection. (more)
- Short-course TPT drugs are now relatively cheap, and the costs of implementing a community-based approach to increase TPT usage could be low relative to the expected benefits. Following recent market-shaping efforts, we expect that short-course pediatric TPT drugs will soon be purchasable for a little over $5 per course on average for children under 5. After accounting for an estimate of the cost of a 2-year program to set up a community-based HCM, the cost per child rises to around $35, but a significant proportion of this cost covers technical assistance to the government that may cause TPT usage to be elevated in the years following the program (more). We expect that an experienced implementer could increase TPT coverage amongst eligible under-5 children by over 20 percentage points in contexts with a facility-based standard of care and relatively low baseline coverage. (more)
- There may be substantial longer-term benefits from averting cases of TB in early childhood. Academic evidence suggests that survivors of TB disease face substantially higher health risks than otherwise similar individuals who have not had TB disease. This may partly be due to the long-lasting effects of TB on their bodies, such as impaired lung functioning. Preventing cases of TB disease may therefore reduce the number of individuals facing these risks, averting deaths and morbidity indirectly as well as directly, though we are particularly uncertain about the magnitude of this benefit in the case of pediatric TB. In addition, we suspect preventing TB disease in young children may boost their incomes later in life and reduce costs to families associated with illness, as with other diseases like malaria. (more)
A sketch of our cost-effectiveness analysis is below for a version of the program implemented in Indian states via a combination of technical assistance to the government and direct financing of procurement and delivery costs. While it suggests the program is 8 times as cost-effective as cash transfers, it excludes any persistent impacts of the program after the initial period in which the program is set up and intensively supported. We think it’s plausible that these persistent impacts take cost-effectiveness to more than 10 times that of cash transfers (more). More generally, our analysis involves taking a stand on several uncertain parameters that could change cost-effectiveness substantially. These parameters are in gray.
| Best guess | 25th-75th percentile range on key parameters | Modeled cost-effectiveness over that range | |
|---|---|---|---|
| Number of under-5 household contacts in target population (hypothetical) | 100,000 | ||
| Share of contacts reached | 60% | 45-75% | 6x - 9x |
| Cost per under-5 child reached | $35 | $25-45 | 6x - 11x |
| Total grant amount | $2,100,000 | ||
| Increase in TPT coverage ratio among contacts reached | 36pp | 15-55pp | 4x - 10x |
| Population-level increase in TPT initiation for under-5 child contacts | 22pp | ||
| Prevalence of TB infection | 30% | ||
| Risk of progression from infection to disease if TPT is not given | 19% | ||
| Effectiveness of TPT in preventing progression from infection to disease | 56% | 35-75% | 5x - 10x |
| Cases of TB disease averted | ~750 | ||
| Case fatality ratio for TB disease in absence of treatment | 35% | 25-50% | 6x - 11x |
| Overall case fatality ratio, accounting for treatment rates | 26% | ||
| Deaths averted via prevention of disease progression | 195 | ||
| Adjustment for deaths averted via increased treatment of TB disease | +30% | ||
| Total number of under-5 deaths directly averted | ~250 | ||
| Moral weight for averted deaths | 114 | ||
| Initial cost-effectiveness estimate | 4x | ||
| Benefit streams (% of total) | |||
| Direct mortality benefits | 48% | ||
| Morbidity benefits from averted TB disease | 1% | ||
| Benefits from averted post-TB sequelae | 17% | 3-30% | 6x - 9x |
| Long-term increases in income | 15% | 4-23% | 7x - 9x |
| Cost of illness averted | 12% | ||
| Benefits for over-5 household contacts | 7% | ||
| Additional adjustments | |||
| Adjustment for downstream costs to others and risk of replacing funding from other funders | -4% | -2 - -22% | 6x - 8x |
| Cost effectiveness (x cash) | ~8x | ||
You can see our full cost-effectiveness analysis for the program here.
Our view of the cost-effectiveness of this program was mostly reinforced by conversations with TB experts, funders and other stakeholders. TB funders gave us the impression that programs to increase uptake of pediatric preventive treatment for TB have been neglected relative to other TB program areas, and that this type of program would be complementary to recent TPT market shaping efforts. Most stakeholders told us that a community-based approach to increasing TPT coverage seemed sensible if there was sufficient health worker capacity to implement it. However, some stakeholders expressed reservations about focusing on children under 5, and about TPT’s effectiveness at reducing mortality risks over the longer term.
How could we be wrong?
Our cost-effectiveness estimate depends on several parameters that we are highly uncertain about. This partly reflects the current state of research on TB and partly reflects the state of GiveWell’s engagement with TB research. Because of this, we have more uncertainty about our final cost-effectiveness estimate than for programs related to some other diseases (e.g. malaria), and some of this uncertainty will only be resolved through additional research by the global TB community. In addition, some of the ways in which we could be wrong reflect programmatic assumptions that we expect to learn more about by making grants.
In particular, we could be overestimating cost-effectiveness because:
- We may be overestimating the number of TB cases and lives saved by increasing TPT coverage for household contacts aged under 5. This in turn reflects uncertainty over the untreated case fatality ratio (more), the prevalence of TB infection and disease (more) and the effectiveness of the 3HP TPT drug regimen at preventing progression to TB disease in young child contacts (more).
- We may be overestimating the effect of a community-based program at increasing TPT coverage relative to existing facility-based systems. This reflects uncertainty about counterfactual levels of TPT coverage (more) and the capacity of health workers to accommodate additional household visits for TB screening and TPT initiation (more).
- We may be underestimating the costs of implementing a community-based program. This includes the financial costs to the implementing organization, as well as the cost of using existing health workers’ time to deliver this program (more).
- We may be overestimating additional benefits of preventing TB disease in young children, such as averted post-TB sequelae, long-term increase in income, and patient costs averted (more).
What is the program?
What is tuberculosis, and what are its impacts?
Tuberculosis (TB) is an infectious disease that usually affects people’s lungs.1 The World Health Organization (WHO) estimated that in 2021, around 10.6 million people fell ill with TB worldwide, and 1.6 million people died from the disease.2 The Institute for Health Metrics and Evaluation (IHME) estimated that TB accounted for 4% of all deaths in low- and middle-income countries in 2019.3 TB is spread from person to person through the air, when a person with TB disease coughs or sneezes.4 The word ‘tuberculosis’ on its own usually refers to illness caused by mycobacterium tuberculosis.5 Only a subset of people with a TB infection develop the illness, and recent research has highlighted the complex continuum of conditions between TB infection and symptomatic TB disease.6 In this report and the accompanying cost-effectiveness analysis, we use the terms ‘TB infection’ and ‘TB disease’ as a binary simplification.7
TB infection is asymptomatic, and can only be detected using a tuberculin skin test or TB blood test. Unless the infection progresses to TB disease, those infected with TB do not feel sick, and cannot infect others. Approximately 5% of infections progress to TB disease during the first two years after infection. After this time, the risk of TB disease decreases significantly.8
Though TB disease typically affects people’s lungs, it can also affect other parts of the body, including the brain, kidneys, spine, or skin.9 Without proper treatment, WHO estimates around 50% of people with TB will die.10 With treatment, around 85% of TB cases are curable.11
Children under 5 face distinct risks from TB. On the one hand they are estimated to account for only a small proportion of TB disease incidence.12 But on the other hand, they are at relatively high risk of suffering severe consequences if infected with TB. After close exposure, children under 5 with evidence of being infected face a roughly 20 percent chance of developing TB disease within 2 years, compared to a roughly 10 percent chance for older child contacts and 5-10 percent for all individuals with a TB infection.13 In addition, children with TB disease, and particularly children under 5 years, are substantially less likely to be diagnosed and treated than adults, increasing their chances of dying from TB.14
What are community-based tuberculosis contact management programs?
Community-based tuberculosis HCM programs involve a health worker visiting an index TB patient in their community and screening their household contacts for TB.15 An index TB patient is an individual who has already been diagnosed and notified as having active TB. During the household visit, household contacts are screened for symptoms of TB; those who are symptomatic are referred for further testing and treatment at a facility, while those who are asymptomatic may be initiated on TPT at the household or referred for further investigation of TB infection. These programs contrast with facility-based HCM programs16 and are intended to increase uptake of TPT among household contacts while also serving as a targeted case-finding mechanism for individuals with TB disease.
The specific version of community-based HCM we investigated largely relies on existing health workers (some of whom are dedicated to TB control activities) to conduct the household visits, screening and TPT initiation, in remote consultation with a doctor where required. This version of the program also involves working with public TB programs and facilities to re-orient HCM processes to support a community-based approach, and paying for program officers to monitor and support household-based activities. Other versions of the program may hire new community health workers, or use more specialized staff (e.g. nurses) to implement activities at the household.18 From talking to an implementer, we understand that in some program settings non-specialist staff are not authorized to provide TPT drugs, meaning that even though the screening happens at the household, contacts must visit a facility to obtain TPT drugs.19
Programs may also differ in terms of the TPT drug regimen used and how it is procured. The specific program we have considered uses a pediatric formulation of the drugs in the 3HP regimen. 3HP is a relatively short-course regimen involving 12 weekly doses of isoniazid and rifapentine.20 3HP would be procured by the program in order to ensure drug supply is not a barrier to TPT coverage. We believe that this approach is representative of programs we would currently fund, given our understanding that wide-scale procurement of pediatric 3HP drugs by governments and the Global Fund has not yet begun in some high-burden countries.21 However, we believe this may change in the future.22
Is the program cost-effective?
What do we estimate?
We have conducted a cost-effectiveness analysis of a specific community-based TB HCM program we considered funding in two states of India. This analysis suggests that the program is 8 times as cost-effective as unconditional cash transfers ("8x cash"). This program is implemented via a combination of technical assistance to the government and direct financing of commodity procurement and some delivery costs. We think there’s a chance that cost-effectiveness could be significantly higher, at around 12x cash, if the implementer can successfully transition the program to government ownership after the initial implementation phase.23
However, a number of parameters in our cost-effectiveness analysis are specific to this particular program and context, and other versions of this program may have higher or lower levels of cost-effectiveness. A sketch of our cost-effectiveness model can be found in the summary section above.
Note that our cost-effectiveness analyses are simplified models that do not take into account a number of factors. There are limitations to this kind of cost-effectiveness analysis, and we believe that cost-effectiveness estimates such as these should not be taken literally due to the significant uncertainty around them. We provide these estimates (a) for comparative purposes and (b) because working on them helps us ensure that we are thinking through as many of the relevant issues as possible.
How do we reach our estimate?
Our cost-effectiveness estimate for a program implemented in two states in India is driven largely by the following factors:
- We estimate that around 8% of household contacts will develop TB in the absence of TPT and that they face a ~25% chance of dying from TB. We combine estimates of the prevalence of TB infection and disease among under-5 household contacts, an estimate of the risk of progression from TB infection to TB disease, an estimate of the case fatality ratio for untreated childhood TB and an estimate of treatment coverage among under-5 household contacts. (more)
- We estimate that TPT reduces the risk of progression from TB infection to disease by 56% in under-5 household contacts. We use an estimate from a meta-analysis of RCTs of isoniazid preventive therapy in children, and make a series of adjustments to account for internal and external validity. (more)
- We expect TPT coverage for under-5 contacts to be 22 percent higher under a community-based approach than a facility-based approach. We first predict the proportion of households reached and TPT coverage for contacts in these households using estimates provided by an implementer with prior experience in implementing this approach. We then compare this to an estimate of TPT coverage under the counterfactual of a facility-based approach. This estimate is derived using data reported by the national Indian TB program and adjustments to account for the coverage differences and expected growth in TPT coverage over time. (more)
- We assume the program costs to the implementing organization of $35 per child reached, including $5 per course of TPT, plus a further $4 per child reached in government costs. To estimate the cost of TPT drugs, we combined the price of pediatric isoniazid and rifapentine (the two components of the ‘3HP’ TPT regimen), reported by Unitaid in December 2023, with estimates of the proportion of children under-5 in different weight bands and dosage guidelines for these weight bands. To estimate non-drug costs, we use a budget provided by an experienced implementer plus rough estimates of the cost of community health worker time and additional facility-based costs as a result of increased testing and treatment for children with symptoms of TB. (more)
- We expect additional benefits of preventing TB in early childhood beyond preventing TB morbidity and mortality, and these account for around half of the total benefits. The additional benefits we account for are deaths and morbidity averted due to averted post-TB sequelae, long-term income increases for individuals who avoid getting TB as a child, averted household costs associated with experiencing TB disease, and reductions in morbidity averted due to averted TB disease. (more)
Our cost-effectiveness model also incorporates several other considerations which are less important to the bottom-line (summarized here, with more detail on sources in our cost-effectiveness model).
The risk of tuberculosis disease and death for under-5 household contacts
We estimate that under-5 household contacts are at high risk of developing TB disease and dying from it relative to the broader population, including in high-burden places. This is one reason why we believe that a HCM program focused on under-5 children is more cost-effective than some other TB programs, such as mass screen-and-treat programs.
We estimate that around 8% of under-5 household contacts have or will develop TB disease in the absence of TPT, and that less than one-third of these individuals will receive treatment for TB disease in India in the absence of community-based HCM.24 This compares to an annual incidence of 0.2% and treatment coverage of 80% in the overall Indian population.25 For children under 5 who do not receive treatment, our best guess is that around one-third will die of TB.
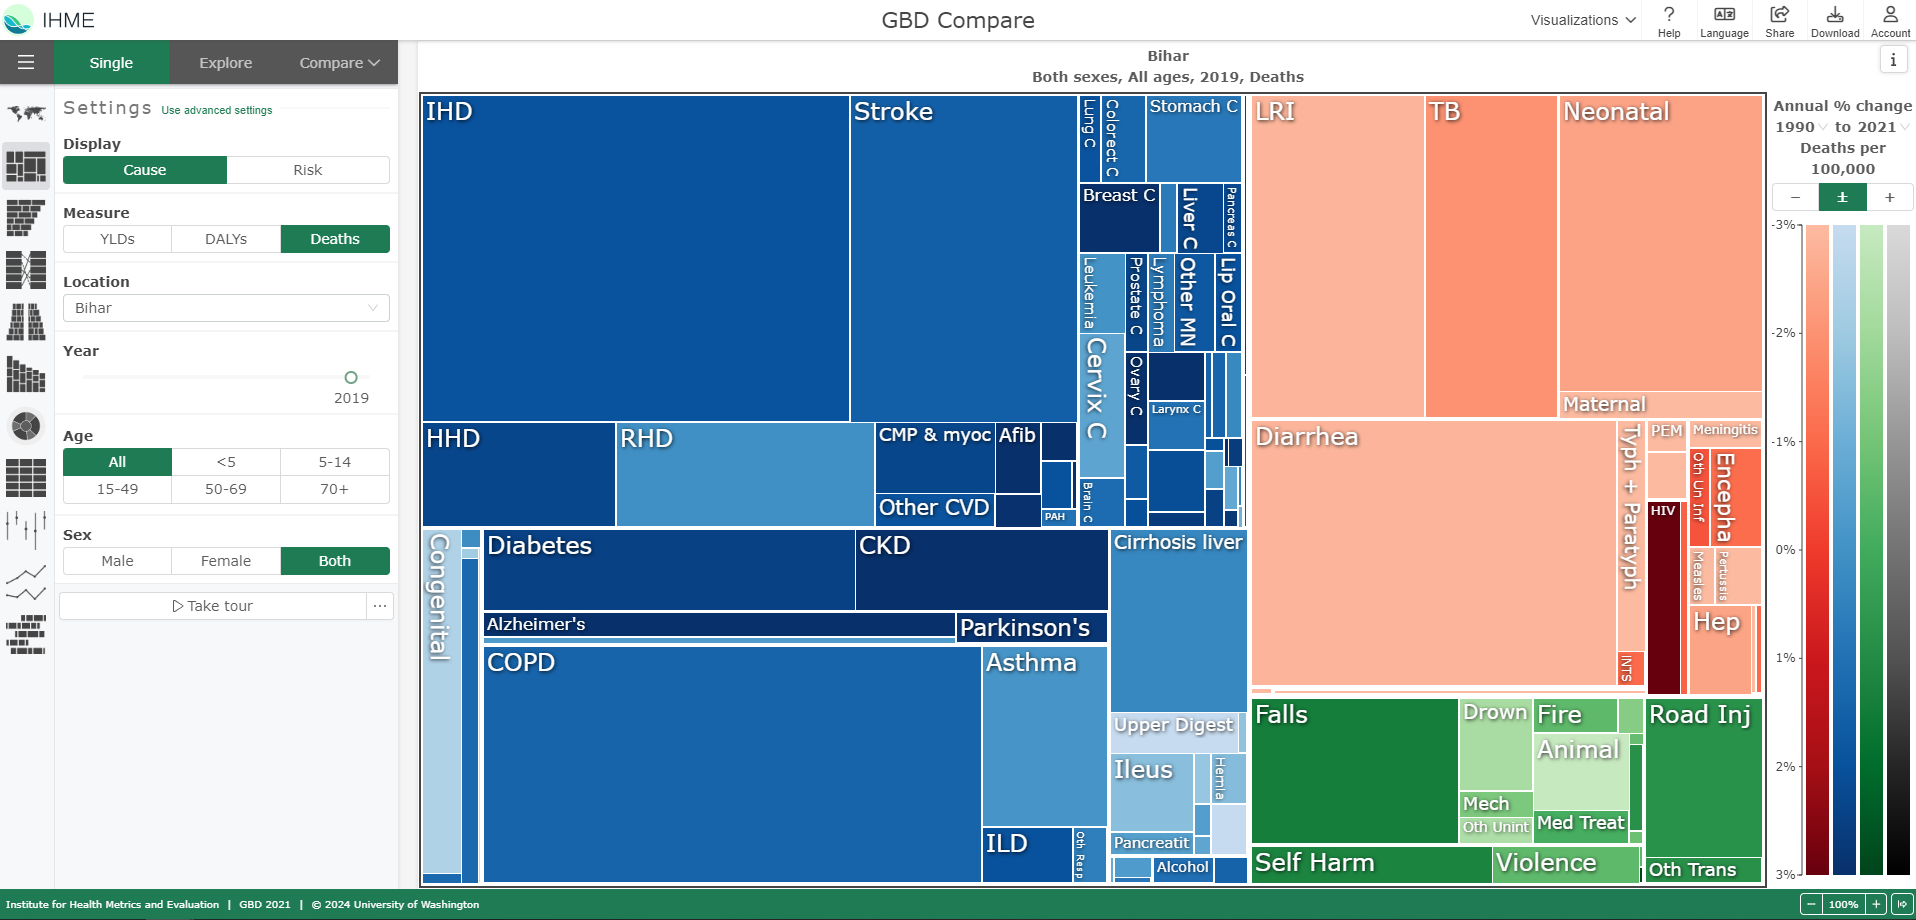
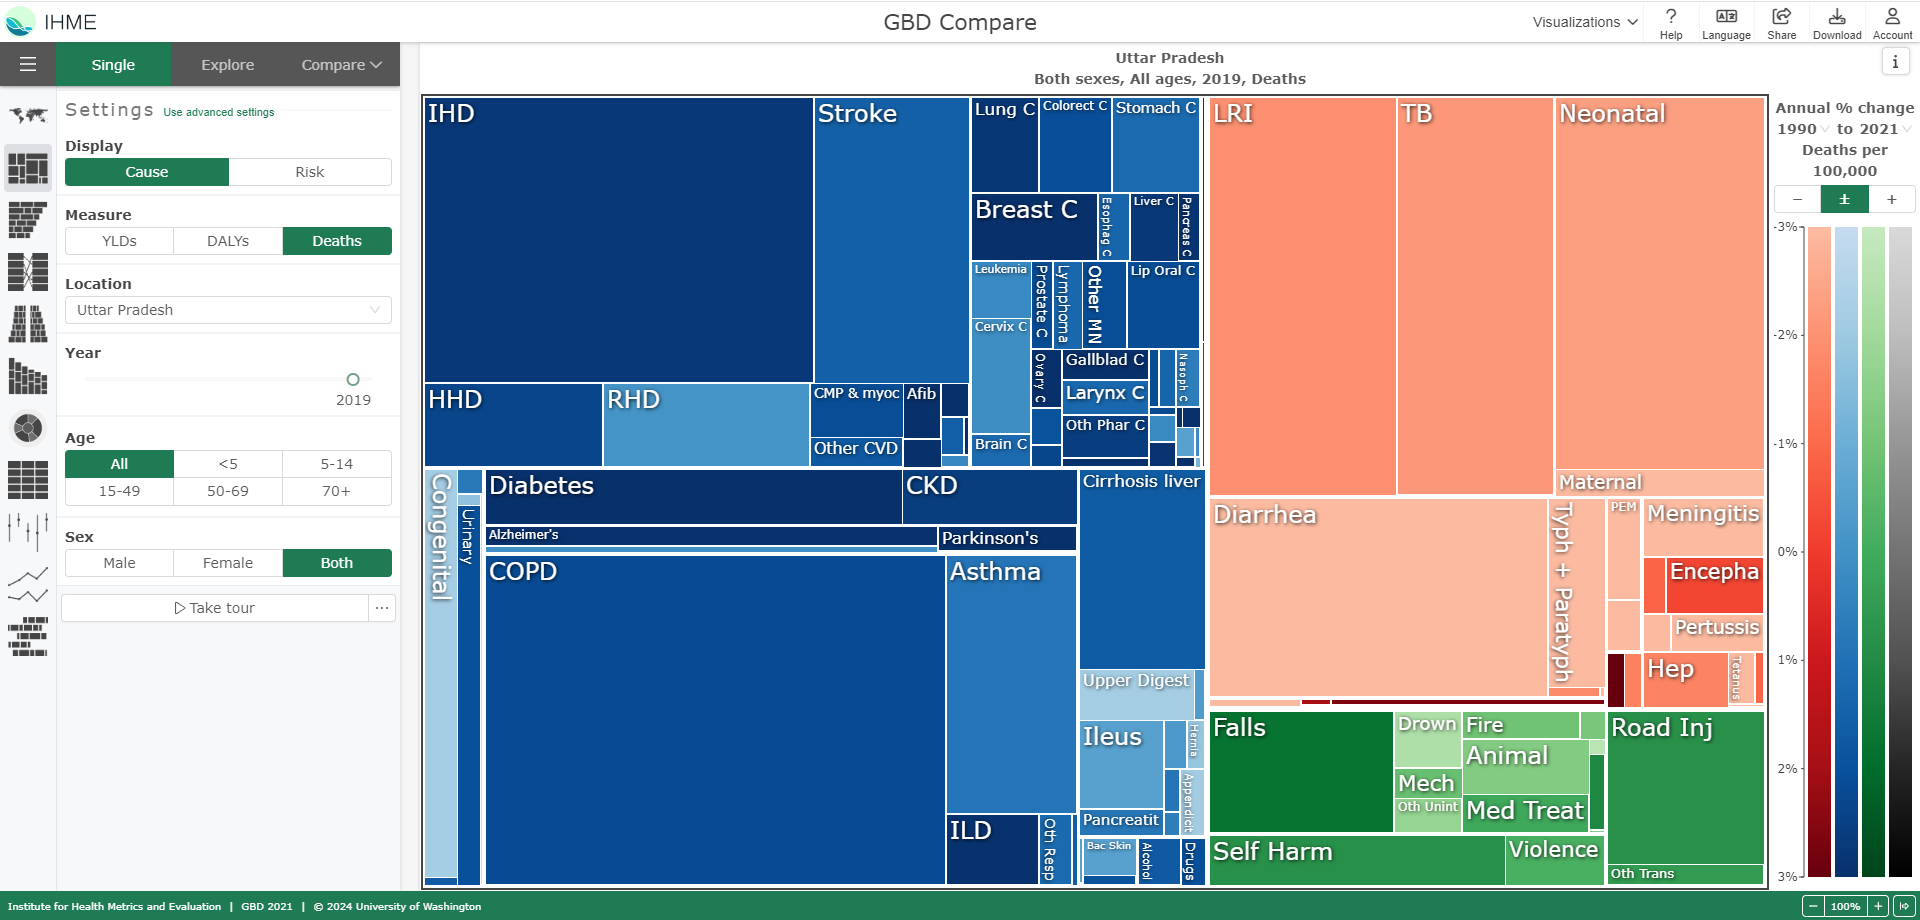
To sense-check these assumptions, we calculated the implied number of under-5 TB deaths per year in Bihar and Uttar Pradesh, the two states we include in our cost-effectiveness analysis, and compared it to estimates of TB deaths from the IHME and WHO. Overall these sense-checks assure us that our assumptions are roughly correct, though we note there are large differences between the IHME and WHO estimates of childhood TB deaths in India. Our assumptions imply a value somewhere in the middle of these estimates.26
We arrive at those estimates using the following sources and methods:
- Prevalence of latent infections may be up to 50% lower in younger children compared to older children30
- Prevalence in LMICs may be around twice as high as in HICs.31 We expect this upward adjustment only partially offsets the previous downward adjustment, because 70% of studies in Martinez et al 2020 are from LMICs, but less than 25% of participants are under 5 (see Martinez et al. 2020, Table 1).
We are unsure if this downward adjustment is the right size to reflect these considerations.
Prevalence of TB disease at the point of screening: our best guess is 2%, based on the same two meta-analyses mentioned above. Fox et al 2013 estimates a 10% rate for under-5s in LMICs32 while Martinez et al 2020 estimates rates of 0.4% at study enrollment, 1.2% within 30 days of enrollment, and 2.8% within 90 days. As mentioned above, the Martinez et al 2020 estimates are for children up to age 19 and include studies from HICs as well as LMICs. We believe that the Fox et al 2018 estimate is too high for our purposes since it includes diagnoses that occur not just at the initial screening but also within 3 months of index patient diagnoses.33 We therefore start with the Martinez et al 2020 30-day estimate and subjectively round it up to 2% to roughly reflect the following considerations:
- prevalence in young children may be up to 3 times higher than in older children34
- prevalence in LMICs may be twice as high as in HICs35
We triangulated the upward adjustment by considering prevalence rates from more recent individual household contact studies and programs reported in Bonnet et al 2023, which range from 0.5% to 3%.36 However, we are still uncertain about the size of this upward adjustment.
Risk of progression from TB infection to disease: our best guess is that, of the 30% of child contacts with TB infection, 19% will progress to TB disease in the absence of TPT. We use the estimate reported by Martinez et al 2020 for children under 5 with signs of a TB infection37 and do not make any further adjustments because we have not seen reasons to expect progression risk to vary substantially across geographies.
We suspect the main reason that the Jenkins et al 2017 estimate could overestimate childhood TB deaths in modern contexts is near-universal BCG vaccine coverage. We estimate that BCG has reduced the case fatality ratio for untreated children by around 20%. Our impression is that evidence on the efficacy of the BCG vaccine suggests it reduces childhood mortality more than it reduces the incidence of TB disease, and that this might partly reflect its greater efficacy against the most severe forms of TB in childhood. To quantify these effects, we constructed a back-of-the-envelope model in consultation with an academic expert.41
However, we remain uncertain about the true case fatality ratio (25th-75th confidence interval is 25-50%) reflecting uncertainties about the efficacy of BCG and the quality of pretreatment era estimates of the case fatality ratio. In particular, we are uncertain about differences in case ascertainment (i.e., the quality and timing of TB diagnosis) between the latest pretreatment era studies and in low-resource contexts today. We have not made an adjustment for this in our estimate because of several considerations that point in different directions, but may review this decision in the future (see footnote for more details).42
We then apply a 30% upward adjustment to this case detection rate, which is for the entire under-5 population, to account for higher rates of treatment among children who are household contacts of a diagnosed TB patient. This upward adjustment is informed by a mathematical modeling study on the effect of household contact management on childhood TB (Dodd et al 2018). To estimate the percent of child contacts with TB who currently receive treatment in high-burden countries, Dodd et al 2018 considers the proportion of childhood TB cases that are accounted for by household contacts, along with assumptions about case detection rates in household contacts and non-household contacts. Under the assumption that every child with TB who is detected (and receives treatment) is a household contact, the treatment coverage for household contacts with TB would be around 1.4 times higher than in the broader population of children with TB.45 This provides an upper bound for the treatment coverage for household contacts. We apply a smaller adjustment of 1.3 since we guess that most but not all detected cases of childhood TB are in household contacts.
The effectiveness of TPT for household contacts under 5
Our best guess is that short-course TPT drugs reduce the risk that a young child with a TB infection progresses to TB disease by a little over 50%. We obtain this estimate by starting with a meta-analysis of RCTs studying the effect of an older form of TPT on children, and applying a series of upwards and downwards adjustments:
- Ayieko et al 2014 estimates that isoniazid preventive therapy reduces the risk of TB disease by 59%, based on six RCTs that included participants aged between 5 months and 15 years.46 The sample included children with and without evidence of a TB infection.47 We start with the estimate that excludes two related studies focused on infants aged 4 months and below because we believe the null effects reported by these studies are not relevant to the contexts and TPT regimens we consider as part of this report.48 We also considered the much larger risk reduction (91%) estimated by the Martinez et al 2020 meta-analysis for child contacts with signs of a TB infection.49 We believe there is a substantial risk that this estimate is biased since it is based on a matching estimator which pools data from a set of observational studies, with a limited number of variables available to adjust for pre-existing differences between those who do and don't receive TPT.50
- We apply a 10% upward adjustment to the Ayieko et al 2014 estimate to account for TPT being more effective in child contacts with a TB infection than those without. We are uncertain about the size of this adjustment but fairly certain about its direction, based on conversations with academic experts and stratified estimates from Martinez et al 2020.51 Our cost-effectiveness analysis assumes that TPT has no effect on children who do not have a TB infection at the point of household screening.
- We apply a 6% upward adjustment to account for the possibility that adherence to shorter-course TPT regimens (and in particular the once a week for 12 weeks 3HP regimen that we have mainly considered) is higher than for the daily regimens of 6 months or longer included in Ayieko et al 2014. While our brief review of adherence studies suggested that the difference in completion rates may be closer to 25%,52 we believe the appropriate adjustment to the effectiveness of TPT is smaller because of our impression that i) some of the effect of the longer regimens can be obtained even without completion and ii) that the shorter regimens were sometimes tested under a directly observed treatment protocol, which we believe inflates adherence relative to scaled-up program implementation. We apply a subjective 50% discount for each of these considerations, reducing the upward adjustment from 25% to 6%.53
- We apply a 10% downward adjustment for internal validity concerns. Although we believe the internal validity of the Ayieko et al 2014 estimate is relatively strong, since it is based on several RCTs, we apply a small downward adjustment since three of the four studies rated as ‘high quality’ were published six decades ago, and also because there is some inconsistency in effect size across studies.54
-
We apply a 10% downward adjustment for external validity concerns not captured in the previous adjustments. Our primary concern is that the effect of shorter-course regimens (such as 3HP) may be less persistent than the effect of the longer regimens included in Ayieko et al 2014. This concern is based on our intuition that the long-term preventive effect of TPT is limited by reinfection risk, which we understand emerges once the TPT course is completed. This intuition was also expressed by a senior decision maker at a large funding organization, who was unsure about the durability of the protection offered by TPT. However, academic experts we spoke to were less concerned about the effects of TPT being short-lived55 and also mentioned that shorter-course regimens with rifapentine could be more effective at clearing the underlying infection than older isoniazid-only regimens. In addition, we expect the program to re-treat children who are re-exposed to a new notified case of TB in their household, since household visits are triggered by notifications of TB cases. We are unsure about the size of any remaining risk resulting from re-exposure to an undiagnosed TB case in the household (which seems unlikely if someone in the household has already sought care for TB, and the household has been visited to explain the risks of TB) or from re-exposure outside of the household.
We also have some uncertainty about the extent to which the estimate we start with generalizes to very young infants, who may be at particularly high risk of progressing to TB disease.56 We understand that 3HP dosing guidelines for children under the age of 2 are currently being developed by WHO.57
We are highly uncertain about the effect of short-course TPT regimens (such as 3HP) on children under 5, given each of the adjustments described above. Our 25th to 75th percentile confidence interval for the effectiveness of TPT in preventing progression from TB infection to disease spans 35-75%.
The increase in treatment coverage generated by a community-based approach
Increase in TPT coverage rates
We believe that there’s a strong intuitive case for a community-based approach to increase TPT coverage relative to a system that requires household contacts to visit a health facility for screening and TPT initiation. Taking sensitization, contact identification, screening and TPT initiation activities to households seems like it would remove much of the cognitive and physical effort involved in a facility-based HCM system. In a facility-based system, our understanding is that TB patients first self-report their household contacts and are then asked to bring their contacts into a health facility for screening and TPT initiation. Offering HCM at households would also eliminate transport costs which could be an additional barrier to families seeking preventive care at a health facility.
Experts and funders we spoke to agreed with this, though some noted that the effect would be context-specific and would require sufficient health worker capacity to implement. We suspect that larger increases in coverage can be generated in settings with lower baseline TPT coverage rates for household contacts, for example due to ineffective/minimal facility-based HCM systems or relatively low engagement with preventive healthcare. Bonnet et al 2023, which we understand to be the only RCT of a community-based HCM program focused on TPT,58 found that a community-based approach in Uganda and Cameroon increased screening rates by 35 percentage points (off a base of 47%) and TPT initiation and completion rates by 18 percentage points (off a base of 62%) relative to the facility-base standard-of-care.59
While the intuitive case for the program increasing TPT coverage seems strong, we are uncertain about the size of this effect. In our cost-effectiveness analysis, we consider two states in India where we expect the benefits of this program to be relatively high.60 Across the two states, we expect an increase of 22 percentage points. In Bihar, where baseline TPT coverage is relatively low, we expect the program to increase TPT coverage by 30 percentage points among all eligible under-5 contacts. In Uttar Pradesh, we expect the program to increase TPT coverage by 18 percentage points among eligible contacts.61 These estimated effects are derived from three parameters in our model:
-
The proportion of households with child contacts that are reached by community health workers: We assume that community health workers will reach 55% of targeted households in the first year of the program and 65% in the second year.62 Our assumption was informed by an implementer’s expectations that a program in India would be able to reach 60-70% of households in the first two years; we applied a small downward adjustment to the implementer’s estimates to account for the possibility that they were over-optimistic. We did not adjust the estimate down further since we think it is highly plausible that more than half of households would be reached. We believe this because: i) the index patients have already demonstrated that they are willing to engage with the health system by getting tested for TB and ii) we think the additional workload this level of coverage would place on existing CHWs is manageable based on calculations we reviewed from the implementer. We are quite uncertain about this parameter, since it is context-specific and dependent on the capacity of existing and potential CHWs, but expect to be able to learn about it by making grants to this type of program.
-
TPT coverage for under-5 contacts who are reached by the community health workers: We assume that 80% of eligible under-5 child contacts in households who are reached by the program will initiate TPT. This is based on: i) published evidence about TPT initiation rates in community-based HCM programs, which suggests initiation rates of 90% are plausible if community-based provision is combined with short-course regimens,63 and ii) an implementer’s data on TPT initiation rates from a previous HCM program in India which included a combination of facility-based and community-based elements (and so was more effortful for household contacts) and produced initiation rates of around 70%.64
-
TPT coverage among eligible under-5 child contacts in the counterfactual: We predict that across 2025 and 2026 this will be around 30% in Bihar and 49% in Uttar Pradesh. We arrived at these estimates in consultation with an implementing organization with recent experience running TB programs in India. We use the following method to estimate counterfactual TPT coverage:
- For the numerator of the TPT coverage rate, we start with the number of TPT initiations by under-5 household contacts of bacteriologically confirmed pulmonary TB (PTB) patients in targeted districts in 2022 (the latest year for which data was available).65
- For the denominator, we start with an estimate of the number of eligible under-5 household contacts of PTB cases in target districts.66 This includes both bacteriologically confirmed and clinically confirmed PTB cases; in the next step we apply an upward adjustment to the TPT coverage rate to account for coverage among clinically confirmed cases.
- We then apply a 45% upward adjustment to account for TPT initiations by household contacts of clinically confirmed PTB patients. According to the implementing organization, data on TPT initiations by clinically confirmed PTB patients is not available at a district or state-level, so we use national data on TPT initiations to determine the size of this upward adjustment.67
- The previous steps excluded districts covered by a Global Fund-supported TPT project, a program which we understand boosted TPT coverage in 2022 but is concluding in 2024. We apply an upward adjustment to account for coverage in these districts. We expect coverage in these districts to revert partially but not completely to the level of coverage in districts that were not supported by this project. We guess that after the Global Fund-supported project concludes, TPT coverage in these districts will be 20% higher than coverage in districts not supported by this project.
-
Finally, we project forward under-5 TPT coverage in Bihar and Uttar Pradesh from 2022 levels to the expected level in 2025 and 2026, in the absence of a community-based HCM program. We assume coverage will grow by 30% per year in Bihar (around 8 percentage points per year) and 10% per year in Uttar Pradesh (around 5 percentage points per year). We assume faster growth in Bihar because it is starting from a lower baseline and we expect some amount of catch-up growth. Our overall expectations of changes in TPT coverage were informed by the implementing organization, who guessed that TPT coverage would grow at 5-10% per year,68 and reports in the 2023 India TB Report, which suggest a much faster growth rate between 2020 and 2022.69
More details on this method are described here.
We do not rely on official reported estimates for TPT coverage since we understand that they only relate to identified contacts of bacteriologically-confirmed pulmonary TB (PTB) patients.70
The program we considered targets all eligible contacts of all notified drug-sensitive PTB (DS-PTB) patients.
We are particularly uncertain about our final estimates for the reasons listed below, but believe the best way to reduce this uncertainty is through grantmaking that involves independent data collection.
- One reason for our uncertainty is that our estimates rely on data that was extracted and reported to us by the implementing organization we consulted. We are unsure about the quality of this data and were not able to review it.
- Another reason for our uncertainty is that we are unsure about how existing programs and new programs that would happen in the absence of this program will affect TPT coverage rates in the future.
Increase in treatment rates for TB disease
In addition to increasing TPT coverage, we also expect community-based approaches to household contact management to increase treatment of active TB by serving as a case-finding mechanism. This view is informed by conversations with TB experts and funders.71 This makes sense to us intuitively, since i) care-seeking could be increased by symptomatic household contacts being screened and informed that they have TB symptoms and ii) doctors may be more likely to diagnose a child with TB if they are a confirmed household contact of an existing TB patient, who has screened positive for TB symptoms, than if the child sought care without a referral.
We expect the size of the positive effect on TB treatment to be smaller than the effect on TPT coverage. This is because even under a community-based approach, household contacts would need to visit a facility for further testing prior to being provided with treatment for TB disease. We tentatively estimate the program to increase TB treatment rates by around 18 percentage points for under-5 household contacts it reaches, and 11 percentage points across all under-5 household contacts (we assume the program reaches 60% of households in the first two years). We expect that around 48 percent of under-5 household contacts with TB would initiate treatment if visited and screened by a health worker, compared to 30 percent in the absence of a household visit (see above for more details about how we estimate treatment rates in the absence of the program). We estimate treatment coverage for those reached by the program by (full calculation in footnote):72
- Calculating the number of under-5 children with TB who screen positive and negative;
- For those screening positive, assuming that 76% are successfully referred to a health facility and tested for TB disease;
- For those screening negative, assuming that 43% seek care and get tested, despite the negative screening result (this is the same rate of care-seeking we expect in the absence of the program across all household contacts with TB disease);73
- Assuming that 80% of those with TB who get tested get diagnosed with TB and are offered treatment, and that 87% of these individuals begin treatment.
The cost of buying TPT drugs and implementing a community-based program
We estimate that a course of 3HP, the short-course TPT regimen used in the program we investigated, will soon cost a little over $5, on average, for children aged less than 5 years. After including the costs of implementation, the cost per child reached increases to around $35 to the implementing organization (including TPT procurement), or $39 including costs covered by the government and other actors.74
Cost of short-course pediatric 3HP
We estimate costs of pediatric 3HP using drug prices announced by the Unitaid-funded IMPAACT4TB program following recent market shaping efforts,75 and combining it with dosage guidelines for children in different weight bands, as reported to us by an implementing organization. We then calculate the weighted average of the cost per course using estimates of the proportion of under-5 children in each weight band. For more details, see our cost-effectiveness analysis.
Costs of implementing a community-based TPT program
To estimate the additional costs of implementing a community-based TPT program, we used the sources described below:
- A budget provided to us by an implementing organization with experience delivering TB programs in India.76 These non-commodity costs equate to around $30 per under-5 child reached.77 A large share of these costs are due to implementer staff providing technical assistance to public and private TB program staff. We believe this technical assistance could lead to a persistent boost to TPT coverage rates in the years after an initial 2-year implementer-led program (see more below).
- An estimate of net costs to the government as a result of this program. This includes i) a rough assumption regarding the monetary value of additional health worker time required to conduct program activities (~$6 per child reached)78 and ii) a calculation of cost savings to government as a result of TPT costs shifting to the program implementer and from fewer active TB cases requiring treatment (~$2 saved per child reached)79 . This net cost is a downstream cost that we account for via a leverage adjustment in our cost-effectiveness analysis, rather than as a cost incurred by the NGO implementer.
We are particularly uncertain about the value of additional health worker time required because we are unsure i) how much time is required for household-based activities, ii) how much spare capacity health workers have, if any, and iii) how time costs would manifest in material terms (e.g. existing activities being replaced by new ones, or by the government hiring additional workers in order to accommodate additional activities). We have therefore not attempted to estimate this parameter in detail, and expect to learn more about the amount of health worker time required and the opportunity cost of this time via grants we make to fund this type of program.
We are quite uncertain about overall costs. We suspect that costs are likely to vary across implementers and will depend on the implementation modalities used (e.g. to what extent implementation leverages existing health workers vs. health workers hired specifically for the program). Our 25th to 75th percentile confidence interval for implementer costs spans $25 to $45 per under-5 child reached. In addition, our estimate of the monetary value of health worker time could change substantially in light of what we learn by making grants to see how this program operates in practice.
We also estimated the net additional facility-based commodity costs resulting from an increased number of symptomatic contacts visiting health facilities for TB testing and treatment.80 Our estimate for these costs is very small in comparison to the costs described above; more details can be found in the cost-effectiveness analysis.
Additional benefits of preventing TB in early childhood
Our cost-effectiveness analysis also accounts for a number of additional benefits we expect to see from this program, beyond childhood deaths averted as a result of preventing and treating TB disease. These additional benefits account for just under half of the benefits modeled in our cost-effectiveness analysis. They are:
- Mortality and morbidity benefits from averted post-TB sequelae (17% of modeled benefits): Our impression from speaking to TB experts and reading two reviews of observational research into the long-term health outcomes of TB survivors is that TB disease is associated with long-lasting negative effects on health, known as post-TB sequelae.81 Although the evidence for sequelae resulting from childhood TB is less well-developed, a recent review suggests a similar range of sequelae has been observed as for adult TB.82 To the extent that TPT can prevent TB disease from developing, it should also avert post-TB sequelae.
To estimate the present-value of the benefits of averting post-TB sequelae, which may occur later in life, we start with an estimate of the causal effect of TB on post-TB disability-adjusted life years. In the absence of random variation in who gets TB, Menzies et al 2021 attempts to estimate the causal effect using a mix of data sources and by assuming that the effect occurs because TB impairs lung function.83
This estimate implies that the additional post-TB DALYs caused by TB are equivalent to 94 percent of the DALYs caused directly by TB, for high TB-burden countries.84
We adjust this estimate downward by 20% to account for internal validity concerns.85
We then obtain the present-value of these benefits by assuming that morbidity and mortality due to post-TB sequelae tends to occur around age 60,86
and applying an annual discount rate of 1.4%.87
This process suggests that the additional present-value of averting DALYs due to post-TB sequelae is equivalent to 35 percent of the DALYs directly due to TB.88
We then apply this proportion to our estimate of the units of value generated by averting morbidity and mortality due directly to TB disease, since our moral weights for preventing deaths and disability imply values similar to those generated by a DALY framework.89
We are highly uncertain about the size of this benefit (25th to 75th percentile confidence interval spans 3-30% of modeled benefits) but do not expect to be able to narrow this uncertainty in the absence of additional long-term follow-up studies of individuals who survive childhood TB.
- Long-term increases in income from averted childhood TB disease (15% of modeled benefits): Our calculation for the income benefits from averting childhood TB is based on benchmarking to estimates of the income effects of seasonal malaria chemoprevention (SMC), another program whose main benefit is averting childhood deaths by averting disease.90 This is because we have conducted a detailed review of the evidence that averting malaria increases income in later life.91 While we have not conducted this type of review for TB, we think it's reasonable to assume that programs which prevent TB in young children (and therefore avert child mortality) might have similar long-term income benefits as those that prevent malaria in young children. However, we are quite uncertain about this assumption and our 25th to 75th percentile confidence interval spans 4-23% of modeled benefits.
- Household illness-related costs averted (12% of modeled benefits): We apply a 20% upwards adjustment to account for averted household costs, in line with the approach for GiveWell top charities described here. This adjustment is based on a more detailed analysis of the household costs of malaria. While we have not considered in detail how the household costs of childhood TB compare to malaria, we think that assuming they are in similar proportion to the mortality averted by malaria interventions is a reasonable first approximation.92
- Morbidity benefits from averted TB disease (1% of modeled benefits): We estimate the morbidity benefits of the program by combining the disability weight for TB disease from the 2019 Global Burden of Disease (0.333), an assumption that TB symptoms in children last on average for a little over a year (taking treatment coverage rates into account), and the additional numbers of TB cases prevented or treated as a result of the program.93
Other considerations impacting cost-effectiveness
Possible transition of an NGO-run program to government ownership
If an NGO implements this program via technical assistance, we think there’s some chance that cost-effectiveness would be substantially higher than implied by our cost-effectiveness analysis. This would occur if the implementer successfully transitions the program to be run by the government. In this scenario, we expect the TPT coverage rate obtained by the program would mostly be sustained after the program concludes. We think that this level of coverage would be higher than what would have been observed in the absence of the program, at least for a few years.
We conducted a very rough analysis that suggests that in this scenario the overall cost-effectiveness of the program would be 12 times that of cash transfers.94
We are highly uncertain about this estimate since it relies on several speculative assumptions which we did not spend much time triangulating. The key assumptions are that:
- Under government ownership, the fidelity of the program would be lower such that only 80% of the households reached by the NGO implementer would be reached, and among those households the initiation rate would be only 90% of that achieved by the NGO implementer. This may be too pessimistic if program reach organically increases as the program matures and is refined, but may be too optimistic if the quality of monitoring and supervision of program activities is much lower when the program is run by the government.
- In the absence of the program, TPT coverage would continue to grow at the rate we assumed it would when estimating counterfactual coverage,95 until it hits a ceiling of 72%.96 This limits the number of years over which the program boosts TPT coverage above the counterfactual. In both Bihar and Uttar Pradesh, this means we assume that the program generates benefits for an additional 4 years after the initial two years of NGO-led implementation. If our assumption about growth in TPT coverage in the absence of the program is too optimistic, the benefits generated by the program would be higher.
- The magnitude of overall benefits generated by the program is proportional to its effect on TPT coverage relative to the counterfactual. In other words, to calculate the benefits generated by the program in each year after transition to government, we take the annual benefit generated in the first two years of the program (after accounting for leverage and funging adjustments) and scale it down proportionately to the smaller effects we expect on TPT coverage in later years.
- The government does not expand the program to cover all districts in the state (the program we model targets roughly two-thirds of districts in each state, selected largely based on relatively high TB burden). An implementing organization informed us that they believe it is highly likely that a government would pursue state-wide expansion if they were to take over this program.97 This means our assumption is pessimistic if the value generated by this program in lower-burden districts is higher than the alternative use of government funds.
In the alternative scenario where the implementer does not transition all elements of the program to government ownership, we expect cost-effectiveness would be closer to the 8x estimate suggested by our cost-effectiveness analysis.
We have not attempted to weight these scenarios to come up with a best guess of cost-effectiveness that accounts for sustained benefits because we suspect that the likelihood of these scenarios varies substantially across implementers and governments.
Reinfection risk
There is a risk that preventing a child at risk of dying from TB from getting TB in a given year may merely delay the timing of TB and death rather than preventing it. This is a concern which applies to disease-prevention programs where there is an ongoing high risk of contracting the disease among a subset of children, and where the treatment does not have a permanent protective effect. We have made a small downward adjustment to our estimate of the efficacy of TPT to account for this risk (see above). We do not apply a larger adjustment because:
- TB mortality in children seems to be concentrated in the youngest children98 , implying that even if reinfection risk persists among these children after they receive TPT, preventing them from getting infected early in life can avert their death across childhood; and
- applying an adjustment to account for these children having lower life expectancy later in life (as a result of ongoing TB infection risk, combined with relatively high TB mortality among adults) would be inconsistent with our approach to moral weights, which places equal value on preventing deaths across people with different life expectancies.99
We are uncertain about the extent to which we should adjust for this risk and may revise this adjustment following further investigation.
Second-order considerations in our cost-effectiveness analysis
Our main cost-effectiveness analysis is informed by several considerations that have a smaller effect on our conclusion than the factors described in detail above. These are:
- Increased TPT and TB treatment rates for older individuals living in target households, due to screening of all household contacts. We think these benefits could be in the order of 10% of the benefits from screening and treating under-5 contacts. We expect that community health workers will screen all household contacts during their visit to target households even though the program is focused on increasing TPT uptake for under-5 children. Although these contacts would be referred to a facility for further testing before any form of treatment is provided, we expect that there would be a small increase in TPT and TB treatment coverage rates for these individuals in the same way that screening and referral to a facility for a symptomatic under-5 contact is expected to boost diagnosis and treatment of active TB (see above). Aside from averting mortality and deaths directly, this increase in treatment could also reduce the transmission of TB to others by reducing the number of contagious individuals in the population.
We estimate the magnitude of these benefits by starting with our benefits estimate of children under-5 and applying a series of adjustments to account for the ways in which benefits would be smaller or larger for individuals aged 5 and over.100 We spent very little time on each of these adjustments, and so we use this approach only to gauge the rough order of magnitude for these benefits. Our adjustments imply that benefits for older household contacts are 7% of total program benefits. If these benefits were increased or decreased by 100%, cost-effectiveness would vary by only a 1x multiple of cash transfers.
Some stakeholders we spoke to expressed reservations about a program focusing on directly supporting TPT uptake for children under 5 only. A program which provides more intensive support to individuals aged 5 and over would likely generate larger benefits for this group, but at higher cost. We have not considered the cost-effectiveness of such an approach.
- The number of pulmonary TB notifications and number of children per household of index patients.101 This affects cost-effectiveness to some degree as we expect some program costs to be fixed relative to scale, resulting in cost-efficiencies from running the program in a region with more index patients and child contacts. However, we suspect that the importance of these parameters is relatively small since we expect the majority of costs would vary according to the number of children reached.
- The proportion of contacts who screen positive for TB symptoms102
, and the accuracy of symptom-based screening.103
We expect this to depend on the prevalence of TB disease among contacts at the point of screening and the sensitivity and specificity of the screening algorithm used. We expect that uncertainty about the results of the screening are of second-order importance because:
- we are fairly certain that a large majority of children will screen negative and be offered TPT, since this was the experience of an implementer who recently conducted symptom-based screening among household contacts in India;104 and
- we expect the program to generate benefits for the children who screen positive, as a result of higher rates of care-seeking at a facility and higher rates of TB diagnosis (see above).
- The effect of providing TPT to a child with TB disease. We expect that a small proportion of child contacts with TB disease will not have symptoms and so will be initiated on TPT. We assume that TPT has only a very small chance of treating TB, but that there are no negative effects of this outcome as we guess that a child contact without symptoms is highly unlikely to be taken to a facility for TB diagnosis and treatment in the counterfactual.105 We expect this assumption to have only a very small effect on cost-effectiveness because the number of children that we expect this to happen to is less than 1 percent of the total number of children whose treatment status we expect to be affected by the program.106
-
Leverage and funging: We incorporate a 4% downward adjustment to cost-effectiveness for leveraged costs incurred by the government as a result of the program and the possibility of funging costs that would have been covered by other actors in the counterfactual.107 While we are uncertain about the magnitude of leveraged costs in particular, they have only a small effect on estimated cost-effectiveness because we guess that the counterfactual value of government spending is fairly low relative to the value generated by community-based HCM for TB.
Is there room for more funding?
We think it’s plausible that there is in the order of $100 million in room for more funding (RFMF) (or $10 million annually over 10 years) for this type of program at our current cost-effectiveness bar. We have not conducted a detailed analysis of RFMF and may revisit this question in the future depending on the success of any initial grants to fund this program.
Our rough guess regarding RFMF is based on an implementing organization’s estimate that there is around $200 million in RFMF at GiveWell’s current cost-effectiveness bar (10 times the cost-effectiveness of cash transfers).108 This estimate is based on:
- Assuming that the program can be implemented in 17 countries, including India. This includes 7 countries in South and South East Asia, and 10 countries in sub-Saharan Africa. Our understanding is that these countries were selected because of their relatively high TB burdens and the implementer’s capacity to deliver in them;
- For each country, calculating the total room for more funding at all levels of cost-effectiveness. This is done by:
- Benchmarking fixed and variable costs (per child reached) to the cost of running the program in a single state in India,109 and applying an adjustment for price differences in healthcare services relative to India;110
- Estimating how long the program would need to be supported for in each country following the initial 2 years of set up and implementation; this varies from 4 years in India, Indonesia, Philippines and South Africa (where the implementer judges the government has sufficient resources to take over the program with relatively little transitional support)111 to 10 years in other countries;
- Identifying which regions in each country would be targeted in the program,112 and the number of child contacts reached per region (based estimates of household size, demographic structure and number of TB patients notified each year);
- Combining the above values to obtain the total room for more funding
- For each country, estimating the average cost-effectiveness of the funding gap. This is done by starting with an estimate of the cost-effectiveness of the program in Indian states113
and adjusting this up or down based on several factors expected to be correlated with cost-effectiveness. These factors are:
- The proportion of the population that is under 5 years of age (larger proportion assumed to correspond to higher cost-effectiveness);
- The gap between current TPT coverage for under-5 HHCs (according to data compiled by national governments and WHO) relative to a 70% maximum expected to be achieved by the program (higher gap assumed to correspond to greater cost-effectiveness);
- The cost of running the program, as proxied by the price of healthcare (higher costs correspond to lower cost-effectiveness).
We apply a subjective downward adjustment to the implementer’s estimate to account for possible overoptimism. We have some confidence in this estimate given it accounts for several national and subnational factors which we would expect to be associated with RFMF. However, we are unsure whether programs would be feasible in all the countries proposed and whether the method for estimating average cost-effectiveness accurately captures variation in cost-effectiveness between countries.
We also think that RFMF in the order of $100 million over 10 years is plausible given the global burden of pediatric TB. WHO estimates that around 500,000 children under the age of 5 fell ill with TB in 2022, and more than 150,000 of these children died.114 If at least 2% of these deaths can be cost-effectively prevented by community-based HCM, at roughly $5,000 per death prevented, this would imply at least $15 million of RFMF per year, or $150 million over 10 years.115
Our process
To investigate household contact management for TB, we:
- reviewed programmatic details provided by an implementing organization who proposed this program to us, and worked closely with them to develop an initial cost-effectiveness analysis;
- conducted targeted reviews of academic literature to refine decision-relevant parameters of the cost-effectiveness analysis;
- spoke to academic experts to get feedback about our cost-effectiveness model and to learn more about particular uncertainties we had regarding existing evidence;
- spoke to other TB funders and stakeholders to learn about their views about this type of program and their broader priorities in TB programing;
- spoke to a representative of another organization considering implementing a similar program;
- had this report and the cost-effectiveness analysis peer-reviewed and vetted internally.
Sources
- 1
“Tuberculosis (TB) is an infectious disease that most often affects the lungs and is caused by a type of bacteria. It spreads through the air when infected people cough, sneeze or spit.” WHO, "Tuberculosis", 2023
- 2
“An estimated global total of 10.6 million people (95% uncertainty interval [UI]: 9.9–11 million) fell ill with TB in 2021, equivalent to 134 cases (95% UI: 125–143) per 100 000 population (Table 2.1.1).” WHO, “TB Incidence”, 2022.
“In 2021, there were an estimated 1.4 million deaths among HIV-negative people (95% uncertainty interval [UI]: 1.3–1.5 million) and 187 000 (95% UI, 158 000–218 000) among HIV-positive people, for a combined total of 1.6 million.” WHO, “TB Mortality”, 2022.
TB also accounts for more deaths globally than either malaria or HIV/AIDs:- "Globally in 2022, there were an estimated 249 million malaria cases and 608 000 malaria deaths in 85 countries." WHO, "Malaria," 2023.
- "630,000 people died of HIV related illnesses in 2022." WHO, "HIV."
- 3
- 4
“Tuberculosis (TB) is a disease caused by a germ called Mycobacterium tuberculosis that is spread from person to person through the air … When a person with infectious TB coughs or sneezes, droplet nuclei containing M. tuberculosis are expelled into the air. If another person inhales air containing these droplet nuclei, he or she may become infected. CDC, “The Difference Between Latent TB Infection and TB Disease”, 2014.
- 5
Tuberculosis definition: "An illness in humans caused by several bacterial microorganisms (species) belonging to the M. tuberculosis complex. The most common and important agent of human disease is M. tuberculosis and can affect any part of the body, creating parenchymal (tissue) damage. It is broadly referred to in the literature as ‘Tuberculosis disease’ or ‘active tuberculosis’.” TB Dictionary, "Tuberculosis (TB)".
- 6
“Latent tuberculosis infection was the term traditionally used to indicate tuberculosis (TB) infection.
This term was used to define “a state of persistent immune response to stimulation by Mycobacterium
tuberculosis antigens through tests such as the tuberculin skin test (TST) or an interferon-γ release
assay (IGRA) without clinically active TB”. Recent evidence indicates that the spectrum from TB
infection to TB disease is much more complex, including a “continuum” of situations didactically
reported as uninfected individual, TB infection, incipient TB, subclinical TB without signs/symptoms,
subclinical TB with unrecognised signs/symptoms, and TB disease with signs/symptoms.” Migliori et al. 2021. - 7
Older work on TB often refers to ‘latent’ or ‘active’ TB. In line with the WHO’s latest guidance, however, we use ‘TB infection’ and ‘TB disease’ in our report.
- 8
- “Persons with latent TB infection do not feel sick and do not have any symptoms. They are infected with M. tuberculosis, but do not have TB disease. The only sign of TB infection is a positive reaction to the tuberculin skin test or TB blood test. Persons with latent TB infection are not infectious and cannot spread TB infection to others.” CDC, “The Difference Between Latent TB Infection and TB Disease”, 2014.
- “The TB skin test is performed by injecting a small amount of fluid (called tuberculin) into the skin on the lower part of the arm … The result depends on the size of the raised, hard area or swelling.” CDC, “Testing for TB Infection”, 2016.
- “TB blood tests are also called interferon-gamma release assays or IGRAs … A health care provider will draw a patient’s blood and send it to a laboratory for analysis and results.” CDC, “Testing for TB Infection”, 2016
- “Following infection, the risk of developing TB disease is highest in the first 2 years (approximately 5%), after which it is much lower [...] The probability of developing TB disease is much higher among people living with HIV, and among people affected by risk factors such as undernutrition, diabetes, smoking and alcohol consumption”. WHO, “Global Tuberculosis Report 2023”.
- 9
- “TB usually affects the lungs, but it can also affect other parts of the body, such as the brain, the kidneys, or the spine.” CDC, “The Difference Between Latent TB Infection and TB Disease”, 2014
- “The symptoms people get depend on where in the body TB becomes active. While TB usually affects the lungs, it also affects the kidneys, brain, spine and skin.” WHO, "Tuberculosis", 2023
- 10
“The death rate for untreated TB is high (about 50%), and therefore the impact of reduced case detection on TB mortality is severe and noticeable within a short time period.” WHO, “Global Tuberculosis Report 2023”
- 11
- “Without treatment, the death rate from TB disease is high (about 50%) (7). With treatments currently recommended by WHO (a 4–6 months course of anti-TB drugs), about 85% of people with TB can be cured.” WHO, “Global Tuberculosis Report 2023”, p. 4
- 12
See Figure 1.1.5 of the WHO, “Global Tuberculosis Report 2023”.
- 13
See Figure 4, Panel A of Martinez et al 2020 for a comparison of progression rates in younger vs. older children.
See Figure 5, Panel B of Menzies et al 2018 for cumulative progression rates estimated by two reviews of TB progression. - 14
- “Estimated treatment coverage is much lower among children than adults (Fig. 2.3.4). Globally in 2022, treatment coverage was 49% (95% UI: 45–53%) among children aged 0–14 years (the age groups related to children for which WHO routinely collects data are 0–4 and 5–14 years; it is recognized that the second category includes young adolescents). The best estimate for those aged 15 years and above was 73%.” WHO, “Global Tuberculosis Report 2023”
- “Around 1 million children are estimated to develop tuberculosis annually, of whom only 36% are notified.3 The greatest case detection failure occurs in children younger than 5 years, who probably account for around half of all paediatric cases.2” Jenkins et al 2017
- “Because many children have difficulty expectorating sputum and because paediatric tuberculosis is usually pauci-bacillary and often extra-pulmonary, paediatric tuberculosis is especially difficult to diagnose with standard sputum-based assays.” Kendall et al 2017
- See below for details on how we estimate the risk of death for children under 5 with TB disease.
- 15
“In order to prevent progression to TB disease, the WHO recommends screening household and close contacts of all ages shortly after the diagnosis of the index patient and provision of TPT when indicated [3]. Contact case management (CCM) comprises all activities related to the management of contacts of TB patients, from identification, screening, TB investigations, and TPT initiation when indicated.”
“A fully decentralized CCM approach, where contact screening, TPT initiation and follow-up take place at patients’ homes has the potential to eliminate several barriers to accessing care. This approach could be more easily integrated in the ongoing community interventions for treatment refill and adherence monitoring of index cases.” Vasiliu et al. 2022.
- 16
“In the facility-based model, the TB index patients are requested to bring their household and close child contacts to the facility for TB screening and TB investigations.” Vasiliu et al. 2022.
- 17
“Children aged < 5 years who are household contacts of people with bacteriologically confirmed pulmonary TB and who are found not to have active TB on an appropriate clinical
evaluation or according to national guidelines should be given TB preventive treatment even if
LTBI testing is unavailable.” WHO, Operational handbook on tuberculosis, Module 1: Prevention.See also Figure 4.1, p. 33, for the algorithm that should be used to rule out TB disease prior to TPT initiation for household contacts under 5.
“Any child < 15 years who has had close contact with someone with TB disease should be screened for TB with a symptom screen and/or CXR as part of active contact-tracing (see Algorithm A.5.1 in Annex 5). Symptoms that should be used to screen for TB are cough, fever and poor weight gain (or weight loss). In young children, reduced playfulness or lethargy should also be included in symptom screening; cough may be absent. It is useful to examine growth charts regularly to determine whether a child has been losing weight or their weight has plateaued. A plateau in weight gain should be a warning sign for possible TB.” WHO, Operational handbook on tuberculosis, Module 2: Screening. - 18
For example, see “Randomisation and masking” section of Bonnet et al 2023: "The community-based approach consisted of symptom-based tuberculosis screening of all household contacts by community health workers at the household, with referral of symptomatic contacts to local facilities for investigations. TPT initiation was done by a nurse in the household, and home visits for TPT follow-up were done by community health workers."
- 19
Implementer confirmed this in review of this page (unpublished).
- 20
“3HP is a short-course TPT regimen that combines two antibiotics active against TB, INH and RPT. 3HP is taken once a week for 12 weeks (12 doses in 3 months).” Unitaid, "Short-course Treatment Regimens to Prevent TB: 3HP and 3RH."
- 21
This is based on our discussions with an implementer and local stakeholders regarding the situation in India.
- 22
We are unsure to what extent a scale-up of government procurement of 3HP would increase TPT coverage on its own, and therefore have not modeled an alternative version of this program that does not need to procure 3HP itself.
- 23
See more on this possibility below.
- 24
This is calculated as 2% of household contacts who already have TB disease at the time of screening, combined with a further 30% who have a non-active TB infection and have a 19% chance of developing TB disease in the absence of TPT. 2% + 30%*19% = 8%
- 25
We calculate annual TB incidence % using the WHO’s 2022 India estimate (2,820,000) and dividing by India’s population in 2022 as reported by the World Bank (1.42 billion):
- WHO TB incidence estimates, as published on the WHO tuberculosis data webpage
- World Bank Open Data: Population, total - India
We use the WHO’s estimate of TB treatment coverage for India in 2022, as reported in the Global Tuberculosis Report 2023 (see Figure 2.3.3).
- 26
The parameters used in cost-effectiveness analysis, when combined with estimates of the case detection ratio for TB in India and a guess at the percent of under-5 TB deaths that are among household contacts, suggest that in 2022 there were roughly 2,500 under-5 TB deaths in Bihar and 6,300 in Uttar Pradesh. These numbers are:
- substantially lower than the numbers implied by WHO’s estimate of under-5 TB deaths in India as a whole. WHO estimates there were ~47,700 under-5 deaths due to TB in India (no further disaggregation is available; see WHO 2023 Global TB Report Github repository, filename ‘db_hn_mortality_disaggregated.Rdata’). Applying Bihar and UP’s shares of the total Indian population (approximately 9% and 17% respectively, according to the 2011 Indian Census), this roughly implies 4,290 under-5 TB deaths in Bihar and 8,100 in UP, though we suspect that the two states’ shares of the under-5 population are meaningfully higher, given they have higher total fertility rates compared to India as a whole (Bihar: 3.0, UP: 2.4, India: 2.0; see India NFHS-5 Report, Table 4.3, p.125);
- 47,700 * 9% = 4,290 under-5 TB deaths in Bihar
- 47,700 * 17% = 8,100 under-5 TB deaths in UP
- substantially higher than Global Burden of Disease (GBD) 2021 estimates of under-5 TB deaths in Bihar and Uttar Pradesh. These suggest there were only ~430 under-5 TB deaths in Bihar in 2021, and ~1,900 in UP. We suspect these estimates are particularly acutely affected by the limitations of using vital registration data and verbal autopsy data to attribute childhood deaths to TB, as discussed in Dodd et al 2017;
- "Direct approaches for estimating tuberculosis mortality use either vital registration data, adjusting for ill-defined causes of death, or verbal autopsy data; both are problematic for children. Recent estimates of childhood tuberculosis incidence suggest a substantially larger incidence of tuberculosis in children than previously appreciated or directly reflected in notification data, with more than 60% of cases unreported or undiagnosed" Dodd et al 2017
- lower than the numbers implied by GBD’s estimates of TB deaths as a share of all deaths in Bihar and UP across all age groups. We looked at the all-age estimates since we expect them to be less affected by the challenges of attributing deaths to TB in children. The GBD Compare Tool suggests that ~4% of deaths among all age groups in Bihar were due to TB in 2019, ~6% in UP, and 3-5% in 2021, when a large share of deaths were attributed to COVID-19. Our model’s estimates, when combined with IHME’s estimates of the total number of under-5 deaths in these states in 2021 (~78,100 in Bihar and 251,600 in UP), suggest that roughly 2-3% of under-5 deaths in Bihar and UP were due to TB:
- (2,483 / 78,053) = 3% under-5 deaths in Bihar from TB
- (6,332 / 251,635) = 2.5% under-5 deaths in UP from TB
Note that our model estimates of TB deaths are affected by our assumptions regarding TPT coverage, TB treatment coverage, and TPT efficacy, in addition to our assumptions about the prevalence of TB among household contacts and the case fatality ratio for children with untreated TB.
- substantially lower than the numbers implied by WHO’s estimate of under-5 TB deaths in India as a whole. WHO estimates there were ~47,700 under-5 deaths due to TB in India (no further disaggregation is available; see WHO 2023 Global TB Report Github repository, filename ‘db_hn_mortality_disaggregated.Rdata’). Applying Bihar and UP’s shares of the total Indian population (approximately 9% and 17% respectively, according to the 2011 Indian Census), this roughly implies 4,290 under-5 TB deaths in Bihar and 8,100 in UP, though we suspect that the two states’ shares of the under-5 population are meaningfully higher, given they have higher total fertility rates compared to India as a whole (Bihar: 3.0, UP: 2.4, India: 2.0; see India NFHS-5 Report, Table 4.3, p.125);
- 27
See Fox et al 2013, Table 2: Prevalence of latent tuberculosis infection in the contacts of TB patients in low-middle- and high-income countries, p.145:
- Low-middle income; ≤ 5 yrs: 35.5% prevalence
We are unsure if this reflects prevalence at baseline contact investigation or within 90 days of index patient diagnosis.
- 28
"Baseline TST or IGRA results were available for 117712 children, among whom 34692 (random-effects prevalence estimate 34·7% [95% CI 29·6–40·1]) had positive tests, with prevalence increasing with age" - Martinez et al 2020, p.978
- 29
“Prevalent and incident tuberculosis were defined on the basis of time from baseline enrolment of the
participant in the contact investigation.” Martinez et al 2020, p.975.We guess that contact investigations in the underlying studies happened on a similar timeline to what we expect to happen in community-based household contact management programs (i.e. within a few weeks of the index patient being diagnosed). We were unable to find a description of the timing of the prevalence measures for latent TB infection in Fox et al 2013, though note that the prevalence measures for active TB disease in this study are for “previously undiagnosed cases of TB among contacts diagnosed during the baseline contact investigation or within the first 3 months after diagnosis of the index patient.” Fox et al 2013, p.142
- 30
In the studies reviewed by Fox et al 2013, prevalence of latent infection in under-5 contacts in LMICs was 35.5%, compared to 65.3% for contacts aged 15 years and older in LMICs (Table 2)
- 31
In the studies reviewed by Fox et al 2013, prevalence of latent infection in under-5 contacts in LMICs was 35.5%, compared to 16.3% in under-5 contacts in HICs (Table 2)
- 32
See Fox et al 2013, Table 1: Prevalence of active tuberculosis among contacts in low-middle- and high-income countries, p.143:
- Low-middle income; ≤ 5 yrs: 10.0% prevalence
- 33
“Prevalent cases of TB among the screened contacts were defined as previously undiagnosed cases of TB among contacts diagnosed during the baseline contact investigation or within the first 3 months after diagnosis of the index patient.” Fox et al 2013 p.142
- 34
In the studies reviewed by Fox et al 2013, prevalence in under-5 contacts in LMICs was 10%, compared to 3.2% in contacts aged 15 years and older (Table 1)
- 35
In the studies reviewed by Fox et al 2013, prevalence among all contacts in LMICs was 3.1%, compared to 1.4% among all contacts in HICs (Table 1)
- 36
“The case detection rate of tuberculosis among child contacts of only 0·5% [at study sites in Cameroon and Uganda] is similar to that found in a community-based programme in Eswatini (0·5%), but lower than that reported in systematic reviews for child and adolescent household contacts (1–3%) and by operational research projects in Cameroon (2·8%) and Uganda (2·4%).” - Bonnet et al 2023, pp. e1918-1919
- 37
“Children with positive baseline TST or IGRA results had significantly higher 2-year cumulative tuberculosis incidence (figure 4A) than children with negative baseline TST and/or IGRA results, and this incidence was greatest among children below 5 years of age (19·0% [95% CI 8·4–37·4]; figure 4).” Martinez et al 2020, p.978
- 38
“Pre-treatment era” studies were conducted before 1946. We assumed children in these studies were untreated because streptomycin, the first antituberculosis drug, was not yet available.” Jenkins et al 2017, p.4.
“Ten datasets reported on children diagnosed with tuberculosis disease during the pretreatment era, all from North America or Western Europe (Figure 3). We assumed included children were HIV-uninfected. For seven of these datasets, we assumed children were not BCG-vaccinated based on the vaccination policies in their countries during the study period;19,23,31 the other three studies specified which children were not BCG-vaccinated, and we included only unvaccinated children in our meta-analysis.” Jenkins et al 2017, p.5.
- 39
"Among children with tuberculosis from the pretreatment era, the pooled case fatality ratio was 21.9% (95% confidence interval [CI]: 18.1%, 26.4%). The pooled case fatality ratio was significantly higher among children aged 0–4 years (43.6%; 95% CI: 36.8%, 50.6%) than among children aged 5–14 years (14.9%; 95% CI: 11.5%, 19.1%)." Jenkins et al 2017
Our impression is that case fatality ratios are measured as deaths within one year of disease diagnosis as this makes it more likely that the death was caused by the disease:
- “For each included study, we extracted the number of children (aged under 15 years) with tuberculosis disease, and the number of children with tuberculosis that died. For cohort studies, we extracted tuberculosis-associated deaths if available or all-cause deaths otherwise. For studies where the follow-up period exceeded one year, we attempted to extract data on deaths in the year after diagnosis or treatment.” Jenkins et al 2017
- “An alternative method of estimating the number of children dying with TB is to multiply case fatality ratios (CFR; which could be defined in this context as the percentage of children that die within a year of a TB diagnosis) by the estimated incidence of pediatric TB.” Jenkins et al 2016
- 40
We compared the number of under-5 TB deaths in Bihar and Uttar Pradesh implied by our cost-effectiveness analysis to two sources to check for discrepancies and to understand whether any discrepancies could be explained:
- At the time, our cost-effectiveness analysis implied that there were around 6,300 under-5 household contact TB deaths in Bihar in 2022, and 17,400 in Uttar Pradesh (UP), including contacts of individuals with TB disease who are not diagnosed and notified. We are unsure about the proportion of under-5 TB deaths that are among household contacts, but our guess is that household contacts account for the majority of TB cases among children. Assuming household contacts account for 80% of under-5 TB deaths, our analysis implied that there were ~7,800 under-5 TB deaths in Bihar in 2022, and ~21,700 in UP.
- ~6,300 / 80% = ~7,800 under-5 TB deaths in Bihar in 2022
- ~17,400 / 80% = ~21,700 under-5 TB deaths in UP in 2022
- Global Burden of Disease (GBD) estimates of deaths in 2019 by cause and region suggested:
- ~490 under-5 drug-susceptible TB deaths in Bihar and ~1,430 in Uttar Pradesh (estimates were accessed through the IHME Client Portal). These estimates suggested we were overestimating TB deaths by ~15x, but we suspected that they may be substantially under-stated due to the difficulties in identifying deaths due to TB in young children (see discussion in Jenkins et al 2016 under ‘Childhood mortality due to TB’).
- 7,800 / 490 = ~16x overestimate of deaths in Bihar
- 21,700 / 1,430 = ~15x overestimate of deaths in UP
- ~100,500 under-5 deaths due to all causes in Bihar, and ~256,800 in UP (estimates accessed through the Client Portal). Taking these estimates at face value, our cost-effectiveness analysis implied that drug-susceptible TB accounted for 8-9% of under-5 deaths.
- 7,800 / 100,500 = ~8% of under-5 deaths from drug-susceptible TB in Bihar
- 21,700 / 256,800 = ~9% of under-5 deaths from drug-susceptible TB in UP
- ~4% of deaths among all age groups in Bihar were due to TB, and ~6% in UP (estimates from GBD Compare tool), 50-66% of what our model implied for deaths among under-5 children.
- ~4% / ~8% = 50%
- ~6% / ~9% = 66%
- ~490 under-5 drug-susceptible TB deaths in Bihar and ~1,430 in Uttar Pradesh (estimates were accessed through the IHME Client Portal). These estimates suggested we were overestimating TB deaths by ~15x, but we suspected that they may be substantially under-stated due to the difficulties in identifying deaths due to TB in young children (see discussion in Jenkins et al 2016 under ‘Childhood mortality due to TB’).
- WHO estimates of TB deaths by age and country in 2022, published on their Github repository (filename ‘db_hn_mortality_disaggregated.Rdata’) suggested:
- ~47,700 under-5 deaths due to TB in India (no further disaggregation is available).
- Combined with IHME’s estimate of under-5 deaths due to all causes in 2022 (~712,800, accessed through the Client Portal), this implies 6-7% of under-5 deaths were due to TB.
- 47,700 / 712,800 = 6-7%
- Combined with Bihar and UP’s shares of the total population (approximately 9% and 17% respectively, according to the 2011 Indian Census), this implies roughly 4,290 under-5 TB deaths in Bihar and 8,100 in UP, though we suspect these are underestimates given the total fertility rate (and hence likely the under-5 share of the population) is higher in Bihar (3.0) and UP (2.4) compared to India as a whole (2.0 - see India NFHS-5 Report, Table 4.3, p.125)
- 47,700 * 9% = 4,290 under-5 TB deaths in Bihar
- 47,700 * 17% = 8,100 under-5 TB deaths in UP
- Combined with IHME’s estimate of under-5 deaths due to all causes in 2022 (~712,800, accessed through the Client Portal), this implies 6-7% of under-5 deaths were due to TB.
- ~47,700 under-5 deaths due to TB in India (no further disaggregation is available).
- Overall we viewed these sense-checks as suggesting that the initial parameters in our cost-effectiveness analysis were overstating under-5 deaths due to TB, but not to the extent suggested by the GBD estimates for under-5 TB deaths in Bihar and UP. Note that several model parameters other than the case fatality ratio were likely to be contributing to TB deaths being overstated, including the prevalence of TB disease among household contacts, baseline TPT coverage, and baseline coverage of treatment for TB disease.
- At the time, our cost-effectiveness analysis implied that there were around 6,300 under-5 household contact TB deaths in Bihar in 2022, and 17,400 in Uttar Pradesh (UP), including contacts of individuals with TB disease who are not diagnosed and notified. We are unsure about the proportion of under-5 TB deaths that are among household contacts, but our guess is that household contacts account for the majority of TB cases among children. Assuming household contacts account for 80% of under-5 TB deaths, our analysis implied that there were ~7,800 under-5 TB deaths in Bihar in 2022, and ~21,700 in UP.
- 41
The model assumes that BCG reduces TB CFR by reducing the proportion of childhood TB cases that are of more severe forms (with higher CFRs) than less severe forms (with lower CFRs). It does this by combing:
- estimates of the proportion of childhood TB cases in the pretreatment era that were tuberculosis meningitis (TBM) and miliary tuberculosis (MTB) (two of the most severe forms of TB and ones that BCG is thought to provide protection against);
- estimates of the case fatality ratio for TBM/MTB vs. other forms of TB in the absence of treatment; and
- estimates of the effect of BCG on reducing risk of TBM/MTB vs. other forms of TB.
We also apply a subjective 10% downward adjustment to CFR to account for the possibility that BCG reduces the TB CFR via channels other than reducing the proportion of TB cases that are TBM or MTB. See calculations and sources here.
- 42
In theory we think that improved case ascertainment could affect estimated CFR in either direction:
- If less severe TB cases were less likely to be identified in the pretreatment era, then the pretreatment era CFR would be overestimated compared to today.
- If, on the other hand, there was a longer lag between TB incidence and identification in the pretreatment era, then the pretreatment era CFR could underestimate the CFR today if some patients died before they were identified as having TB.
We think it’s plausible that the pretreatment era estimate of CFR does not significantly overstate or understate the CFR for untreated children in low-resource settings today because:
- According to Drolet 1938 (which contributes 90% of the total sample included in Jenkins et al 2017), the stability of the CFR over time (between 1917 and 1930s) suggests that it is not the case that as more cases become known to the system the CFR drops. "E.g., [For New York] For the three-year period 1915-1917, the case fatality rate was 44 per cent and two decades later, during the recent three-year period 1933—1935, it was still 42 per cent", "[For Chicago] Comparing the ratio in the three-year period 1915—1917 against that of the three years 1933-1935, we find the case fatality had risen from 30 to 35 per cent", "[For Philadelphia] The ratio of deaths to cases, which stood at 55 per cent during the three-year period 1915-1917, was still the same during the years 1933 to 1935"
- Drolet 1938 argues that the proportion of TB cases that were detected increased over the period where CFR appeared to be stable: “In the main, even though it is acknowledged that many cases of tuberculosis are not reported or identified until near the end or at death, there are several reasons or factors making for a rather thorough registration of this disease, or for the reporting of cases more frequently now than formerly. First, the extensive provision of institutional facilities assures almost automatically that at least the cases going through them will at some time or other be reported to the authorities, either when applying or when caught in the meshes of the follow-up systems. Second, the frequency nowadays of special surveys for tuberculin-testing and case finding also assures the recognition of a greater number of cases. Third, many large industrial and business establishments as well as civil service commissions now require physical examinations prior to employment, leading thereby to the identification of cases. Finally, the availability and wider use of the X-ray these days also contribute to the discovery of more cases than formerly. Then, too, the continuous search by visiting and public health nurses for possible contacts of tuberculosis cases uncovers many secondary cases.” (p.127)
- Our impression is that the core methods used to diagnose TB in the 1930s – a combination of sputum smear microscopy, clinical examination and chest x-rays – are still in widespread use in low-resource settings today. According to the 2023 India TB report, microscopy (rather than more sensitive molecular diagnostics) were still being used for the large majority of TB examinations in 2022 (Figure 3.3, p.32).
- 43
See underlying data and calculations here
- 44
The World Health Organization seems to equate case detection and treatment, as suggested by the following description of their TB burden estimates: “WHO TB burden estimates … [include] WHO-generated estimates of TB mortality, incidence (including disaggregation by age, sex, risk factors, HIV status, rifampicin resistance), case fatality ratio, treatment coverage (previously called case detection rate) and TB infection estimates in household contacts.”
Intuition suggests that not all detected and notified cases will be treated, suggesting the case detection rate overestimates treatment coverage, but an academic expert informed us that cases that are treated in the private sector in India are sometimes not notified, suggesting the case detection rate underestimates treatment coverage. We guess that these offsetting considerations roughly balance out.
- 45
“However, we are interested in children cohabiting with notified TB cases, for whom the CDR might reasonably be expected to be higher. At one extreme, it could be the case that every child notified with TB is from a household with a notified adult TB patient. Previous work modelling work for high-burden countries2 suggested around 70% of TB incidence in children might occur in households with adult TB cases, implying the upper-bound CDR for cohabiting children would be higher by a factor of 1/0.7 = 1.4 (corresponding to assuming all notifications were from households with an index case [numerator], but only 70% of total child incidence occurs in this group [denominator]).” Dodd et al 2018, supplementary appendix, p.13.
- 46
“We included only randomized controlled trials (RCTs) involving children aged ≤ 15 years, regardless of their HIV status, comparing INH (4–20 mg/kg) with placebo or no prophylaxis. The studies had to have been published in English in peer-reviewed journals. Publications were of any date through October 2012. Studies were restricted to RCTs to provide the strongest evidence for the efficacy of INH.” Ayieko et al 2014, p. 2.
“The results of our analysis suggest that INH prophylaxis reduces the risk of TB by 59% among children ≤ 15 years of age, excluding a subset of young children on whom INH was initiated at four months of age or earlier for primary prophylaxis (RR = 0.41, 95% CI 0.31, 0.55 p < 0.001).” Ayieko et al 2014, p. 9.
- 47
“To explore heterogeneity among studies, we performed subgroup analyses based on the HIV status of the children, duration of administration of INH prophylaxis (< or ≥ six months), age of participants (arbitrary cut-off set at 5 years of age), primary and secondary prophylaxis, TB endemicity where the study was conducted, and quality of the study. Primary prophylaxis here refers to administration of INH for prevention of TB infection while secondary prophylaxis refers to administration of INH to prevent TB disease.” Ayieko et al 2014, p. 2.
- 48
We believe that these two studies, published in Madhi et al 2011, provide relatively little information about the effect of TPT in the program contexts we consider, since they:
- aimed to exclude children who had been recently exposed to a TB patient: “Eligibility criteria included receipt of the BCG vaccine by 30 days of age; no history of tuberculosis in the infant, known exposure to a microbiologically confirmed case of tuberculosis, or active antituberculosis treatment in the mother at the time of the infant's birth; and no evidence of failure to thrive, recurrent pneumonia, chronic diarrhea, or immunosuppressive conditions other than HIV infection.” Madhi et al 2011, p. 22.
- may have been undermined by challenges with adherence, given the need to crush and dissolve tablets on a daily basis for nearly 2 years, combined with the young age of the infant: “Infants were randomized in a 1:1 ratio to receive either daily INH or placebo (Be-Tabs Pharmaceuticals (Pty) Ltd.; Johannesburg, South Africa). … The child’s primary caregiver was trained and given instructions at study-entry and each subsequent scheduled visit on the method of study drug administration. This included the dosage and the manner in which tablets were to be crushed and given with 30 minutes of mixing in water either 30 minutes before or 2 hours after feeding. … Study participants were to receive randomized treatment for 96 weeks and followed for an additional 96 weeks for a total 192 weeks on study.” Madhi et al 2011, supplementary appendix, pp. 2-3
- targeted children who had been exposed to HIV: “The dual epidemic of human immunodeficiency virus (HIV) and tuberculosis is a major cause of sickness and death in sub-Saharan Africa. We conducted a double-blind, randomized, placebo-controlled trial of preexposure isoniazid prophylaxis against tuberculosis in HIV-infected children and uninfected children exposed to HIV during the perinatal period.” Madhi et al 2011, p. 21
- 49
"The effectiveness of preventive therapy was 63% (adjusted HR 0·37 [95% CI 0·30–0·47]) among all exposed children, and 91% (adjusted HR 0·09 [0·05–0·15]) among those with a positive result for tuberculosis infection", Martinez et al 2020, p.973
- 50
“In total, study groups from 46 cohort studies in 34 countries—29 (63%) prospective studies and 17 (37%) retrospective—agreed to share their data and were included in the final analysis.” Martinez et al 2020, p. 973.
“When evaluating the protective effect of preventive therapy, we did a propensity score analysis, with matching based on individual-level covariates of age, sex, and study design. We then matched children who began preventive therapy with children who did not using a nearest-neighbor matching algorithm.” Martinez et al 2020, p. 977.
- 51
- Martinez et al 2020: “The effectiveness of preventive therapy was 63% (adjusted HR 0·37 [95% CI 0·30–0·47]) among all exposed children. The effectiveness was greater in children with baseline infection (adjusted HR 0·09 [0·05–0·15]), and had a non-significant relation in children without baseline infection (adjusted HR 0·66 [0·40–1·10]).” p. 979.
- We believe the size of this difference may be overstated, since baseline infection status was not randomly assigned.
- 52
- Villarino et al 2015, comparing 3HP under supervision to 9-month daily isoniazid without supervision, in children aged 2-17: “The overall treatment completion rates were 88.1% in the combination-therapy group and 80.9% in the isoniazid-only group (P = .003)” p. 6.
- Njie et al 2018, comparing 3HP to other TPT regimens; we did not look into which populations this meta-analysis covered: "Three-month isoniazid-rifapentine was determined to be equal to other latent tuberculosis infection regimens in effectiveness (OR=0.89, 95% CI=0.46, 1.70), and has higher treatment completion (87.5%, 95% CI=83.2%, 91.3%) compared with other latent tuberculosis infection regimens (65.9%, 95% CI=53.5%, 77.3%).”
- Menzies et al 2018, comparing a 4-month daily regimen to a 9-month regimen in an RCT with 7,000 adults with evidence of a TB infection: “The rate of treatment completion in the phase 3 trial was significantly higher with the 4-month rifampin regimen than with the 9-month isoniazid regimen (difference, 15.1 percentage points; 95% confidence interval [CI], 12.7 to 17.4) (Table 2)” - 53
(1 + 25%) * (1 - 50%) * (1 - 50%) = (1 + 6%)
- 54
- The three studies rated "high quality" that were published six decades ago are:
- Egsmose et al. (1965)
- Comstock et al. (1962)
- Mount et al. (1961)
The risk ratios that underlie the estimate we use are: 0.28, 0.61, 0.40, 0.38, 0.33, and 0.40.
See Table 1, Ayieko et al 2014, p. 4.- “The quality of six of the trials [18-21,23] was rated as high; the remaining two trials were rated as low quality [22,24].” Ayieko et al 2014, pp. 3-4.
- Note that two of the studies rated as high-quality (published in Madhi et al. 2011) are excluded from the estimate we use. See this footnote for details.
“On pooling the eight studies, marked heterogeneity in the efficacy of INH was observed (Chi2 18.56, df = 7, I2 = 64.3% p = 0.01) (Figure 2); upon conducting a sensitivity analysis, we noted that by excluding the two studies by Madhi et al. that included infants on whom INH had been initiated at four months of age or earlier, the heterogeneity disappeared (I2 = 0.0%, p = 0.799), demonstrating that these two studies were the principal contributors of the heterogeneity observed in the meta-analysis.” Ayieko et al 2014, p. 4.
- The three studies rated "high quality" that were published six decades ago are:
- 55
Our impression is that this is at least partly based on earlier studies of TPT which have found that protective effects persist even over fairly long follow-up periods. For example, a 1999 Cochrane Review of TPT found a risk reduction of around 60 percent over a follow-up period of at least two years, with no significant difference in effect between 6-month and 12-month courses of TPT. Some studies contributing to this review had follow-up studies of 5-10 years. The review also mentions a 30-year follow-up of children who received TPT, suggesting “treatment benefit is likely to be life-long”:
- “Eleven trials involving 73,375 patients were included. Trials were generally of high quality. Treatment with INH resulted in a risk ratio (RR) of developing active TB of 0.40, (95% confidence interval (CI) 0.31 to 0.52), over two years or longer. There was no significant difference between six and 12 month courses (RR 0.44, 95% CI 0.27 to 0.73 for six months, and 0.38, 95% CI 0.28 to 0.50 for 12 months).”
- “Four of these studies (Comstock 1962; Ferebee 1962, Ferebee 1963; Mount 1962) were sponsored by the United States Public Health Services. All were started in the 1950s and concluded in the 1960s. Included were large groups of individuals at risk of tuberculosis due to recent or remote contact with an active case of pulmonary tuberculosis; living in geographic areas of high incidence and prevalence of disease; or living in a psychiatric institution. … Follow‐up was active for 2 years, followed by passive reporting to the public health department for 10 years. Five and 10 year follow‐up and long‐term toxicities were included in an extensive review (Ferebee 1970).”
- “Third, the results of 5 years of follow‐up may not predict long‐term TB risk. However, a 30‐year follow‐up of a cohort of children suggests that treatment benefit is likely to be life‐long (Hsu 1984).”
- 56
This is because of the null results of the Madhi et al 2011 studies referenced in footnote 48.
- 57
“WHO currently recommends the use of 3HP in children 2 years of age and above. Dosing for younger children will be reviewed by the WHO Technical Advisory Group on dosing in Q1 2024.” Unitaid, "New Child-Friendly Formulation of Rifapentine for Short Course Tuberculosis Prevention Treatment Now Available as Unitaid and IMPAACT4TB Launch an Early Market Access Vehicle."
- 58
“Large trials had evaluated the effects of community-based tuberculosis household contact screening on tuberculosis detection rates, but very few have included TPT management at the household level. We searched PubMed up to Dec 29, 2022, for studies reporting community-based approaches for the management of TPT among household child contacts. We used the search terms (“tuberculosis preventive treatment” OR “tuberculosis preventive therapy”) AND (“household child contacts”) AND (“community”), with no language restrictions. We identified two relevant publications but no randomised control trials: one prospective cohort in Ethiopia reporting experience of delivering preventive isoniazid treatment using health extension workers, and one study reporting experience of a community-based programme for delivering a 3-month regimen of rifampicin–isoniazid preventive treatment by nurses in Eswatini.” Bonnet et al 2023
- 59
“Among all child contacts declared, 1548 (81·9%) of 1889 in the intervention group and 475 (47·3%) of 1005 in the control group were screened for tuberculosis. 1400 (48·4%) child contacts were considered to be in the TPT target group: 941 (49·8%) of 1889 in the intervention group and 459 (45·7%) of 1005 in the control group. In the TPT target group, TPT was commenced and completed in 752 (79·9%) of 941 child contacts in the intervention group and 283 (61·7%) of 459 in the control group (odds ratio 3·06 [95% CI 1·24–7·53]).” Bonnet et al 2023
- 60
These are Bihar and Uttar Pradesh. We conducted a preliminary cost-effectiveness analysis for a wider range of locations but decided to focus our efforts on modeling cost-effectiveness in these two states since they had the highest cost-effectiveness in the preliminary analysis. For Bihar, this primarily reflected a low baseline level of TPT coverage for children under-5, while for Uttar Pradesh it primarily reflected a high number of TB notifications and child contacts relative to expected program costs.
- 61
These estimates are calculated as (estimated TPT participation rate among those offered TPT at household visits - counterfactual TPT coverage rate) * percent of target households expected to be reached.
- 62
Our understanding is that this program could be rolled out in such a way that the households who are not reached will continue to be served by the existing HCM system.
- 63
- Bonnet et al 2023, a study of a community-based child contact management program delivering 3HR in Cameroon and Uganda:
- 99.3% TPT commencement rate for under-15 children eligible for TPT (after having been screened) (see Table 3, intervention group column)
- Dongo et al 2021, a study of a “decentralized programme for detection, treatment and prevention of tuberculosis in children” in Uganda, where the regimen was six months of daily isoniazid:
- “Eligible child contacts who initiated IPT 670 or 77% of 910 eligible” [this refers to children under-5 who screened asymptomatic] - See Table 1
- Schwoebel et al 2020, a study of children under-5 living with an adult PBCT patient in “the largest cities in Benin, Burkina Faso, Cameroon and Central African Republic.” “Children free of active TB were offered preventive treatment with a 3-month rifampicin-isoniazid (3RH) or 6-month isoniazid (6H) regimen in Benin.”:
- “Among the 1909 children free of TB, 1745 (91%) started preventive therapy”
- Kay et al 2021, a study of a community-based TB contact management program in Eswatini. “Vikela Ekhaya offered differentiated TB and HIV testing for household contacts of TB cases by using mobile contact management teams to screen contacts, assess their TPT eligibility, and initiate and monitor TPT adherence in participants’ homes”
- “A total of 322 of 330 (98%) eligible asymptomatic household contacts initiated TPT.” This includes children under-5 and people living with HIV, with a mix of regimens.
- Mandalakas et al 2021, a study of community-based screening and TPT initiation in South Africa, offering eligible contacts isoniazid-only preventative therapy. “During the study period, local guidelines recommended TPT with 6 months of daily isoniazid for children <5 years of age and all children living with HIV, after exposure to a patient with infectious TB or following a positive TST. Children were not offered TPT if they did not qualify per local guidelines. After excluding TB in the child and providing family education, the study team referred eligible children to community-based TB clinics for IPT.”:
- “ 240 out of 326 (74%) eligible children initiated isoniazid preventive therapy under programmatic guidelines.”
- Bonnet et al 2023, a study of a community-based child contact management program delivering 3HR in Cameroon and Uganda:
- 64
- "71% of identified eligible HHCs aged 0-5 years and 5-15 years were initiated on 3HR under a Global Fund-supported TPT project implemented in 5 states." GiveWell correspondence with implementer involved in the Global Fund-supported TPT project (unpublished)
- “Kerala state demonstrated the experience of implementing 3RH TPT regimen in eligible HHC aged 0-5 years and 5-15 years between November 2020 and August 2022. In this experience, 71% of the eligible HHC were initiated on 3RH with 97% completion rate and negligible adverse events. Based on this, CTD expanded the 3RH TPT regimen in the State of Punjab, Gujarat, Andhra Pradesh, Odisha and Madhya Pradesh as an alternate TPT regimen for eligible HHC <15 years of age in August 2022.” India TB Report 2023
- 65
We exclude roughly 30% of districts because they were covered by a Global Fund-supported TPT project, a program which we understand boosted TPT coverage in 2022 but is concluding in 2024. According to the implementing organization, TPT coverage will fall in these districts once implementation concludes, since this program relied heavily on health workers hired by the implementer. Implementer confirmed this in review of this page (unpublished).
- 66
Again we exclude districts where the Global Fund-supported TPT project was not implemented.
- 67
Implementer confirmed this in review of this page (unpublished).
- 68
The implementer explained that they expected growth to slow substantially from the rate observed between 2020 and 2022 because that reflected a ‘start-up phase’ where TPT coverage was increasing from a low base, in response to the 2021 policy change. Implementer confirmed this in review of this page (unpublished).
- 69
See India TB Report 2023, Figure 5.2, p. 53. Note that this figure includes TPT initiations for all HHCs, not just under-5 HHCs, and the rapid increase may reflect expansion of TPT to the over-5 HHC group as a result of a policy change in 2021 (see p. 52 for details of the policy change, which expanded TPT coverage from the most high-risk groups to include all HHCs of pulmonary TB patients). We guess that the boost to TPT coverage provided by this policy change was temporary and will not generalize to the change in TPT coverage for under-5 HHCs.
- 70
We understand a contact to be ‘identified’ once they are reported to a doctor and entered into Nikshay, India’s administrative database for TB. Some contacts who would be eligible for TPT (i.e. a household contact of a pulmonary TB patient, who has been ruled out of requiring treatment for TB disease) have not been captured by contact tracing systems and have therefore not been identified. See Tables 7.1 and 7.2 of India TB Report 2023, pp.271-273. The third column of Table 7.1 shows that not all TB patients were contact-traced, resulting in not all household contacts under the age of 5 being identified (‘enumerated’; column six). By comparing the number of household contacts who have been identified in Table 7.1 with the number of household contacts used in the denominator of the TPT initiation rate in Table 7.2 (the last two columns) it becomes evident that the TPT initiation rate is calculated only for the subset of identified contacts.
- 71
- “My general perception is that often people think about household contact management as a TPT intervention. But actually it's also an active case finding intervention because you're looking to find kids who have TB, who are at high risk of having TB, and because they've already got TB, they're one stage closer to the outcome of death, so finding a kid with TB and getting them onto treatment is a big deal” Pete Dodd in conversation with GiveWell, December 2023 (unpublished).
- “One thing that we should always think about with contact screening is not only to exclude tuberculosis so you can give contacts TB preventive treatment, but also if there is a case of TB in that household, then there is a likelihood of more TB cases and undetected cases in the same family. … so we will be able to diagnose more TB cases earlier in the course of the disease, and we can prevent these individuals from dying.” Dr BK Mishra (Bihar State TB Officer) in conversation with GiveWell, December 2023 (unpublished).
- “Historically there have been active case finding programs and then there's been [prevention] programs. But as we've got shorter prevention treatments, better tools, more decentralized approaches, it makes more financial sense to really start combining these where you are doing active case finding linking to TB prevention. So whether it's community-based or facility-based, when you find a case at the same time, you then screen their contacts, start them on TPT if they're eligible, if they've got signs and symptoms of TB, put them on to TB treatment and if not start them on TPT if they're eligible.” Grania Brigden (Global Fund) in conversation with GiveWell, December 2023 (unpublished).
- 72
- 73
We assume that contacts with TB disease who are screened negative would seek care at the same rate as contacts with TB disease who are not screened since we expect that any negative effect on care-seeking from receiving a negative screening result would be roughly offset by a positive effect of being sensitized to the possibility that i) they may catch TB from the index patient and ii) the symptom screening is not definitive, and should therefore seek care if symptoms emerge.
- 74
Note that this estimate accounts for:
- costs to the implementer that we expect would have been covered by the government in the absence of the program, such as the cost of TPT that would have been provided in facilities
- costs to the government and other actors that are averted as a result of the program
- the fact that not all children reached will be eligible for or agree to take-up TPT
- 75
See IMPAACT4TB Product Brief - TB prevention and short-course TPT for children, December 2023. See Table on page 2 for pricing of taste-masked, dispersible isoniazid and rifapentine tablets. We use the $0.03 per tablet pricing for isoniazid because we believe it is likely that this product will be successfully developed and approved in the near-term, and hence is the most likely price at which isoniazid would be procured by a program we would fund.
"The Unitaid-funded IMPAACT4TB Consortium, led by the Aurum Institute, which pioneered the introduction of shorter, rifapentine-based TB preventive treatment options, is announcing that the new formulation will reach the market at a price of US$6,53 – US$15,80, depending on the weight of a child. The affordable price also means that 3HP treatment in children is now cheaper than alternative TB preventive treatments available for children. This is the first time low- and middle- income countries will avoid a higher price per tablet for a paediatric TB formulation.
The IMPAACT4TB Consortium, since its inception in 2017, has worked to overcome barriers to access patient-friendly formulations of rifapentine-based regimens, pushing manufacturers to develop and commercialize these products. This resulted in the procurement of over 4.2 million patient courses of 3HP across 78 countries. The paediatric formulation, now available to governments and global health procurers in more than 135 countries, is water-soluble and raspberry-flavoured, making it easy to administer and more acceptable to children." Unitaid, "New Child-Friendly Formulation of Rifapentine for Short Course Tuberculosis Prevention Treatment Now Available as Unitaid and IMPAACT4TB Launch an Early Market Access Vehicle." - 76
This budget was revised through several rounds of discussion with GiveWell, and we feel fairly confident that it represents the organization’s best guess of the costs of the program.
- 77
- 78
This is based on a guess that the cost of additional time required for health workers as a result of this program is equivalent to 20% of the non-commodity cost incurred by the implementer, or about a quarter of total non-commodity costs. This is roughly in line with other GiveWell CEAs where we have attempted to account for in-kind government costs (e.g. Vitamin A supplementation (30% of total costs) and clubfoot treatment (20% of implementer costs). We chose the lower end of this range since i) the cost of private-sector health worker time is already captured by the financial incentives included in the implementer’s budget, and ii) because the additional time required from public-sector health workers seemed moderate in calculations conducted by the implementing organization who proposed this program to us.
- $1,515,559 non-commodity cost to government
- 252,543 children under-5 reached by the program
- $1,515,559 / 252,543 = $6 per child reached
- 79
- Government TPT costs averted is calculated as the estimated number of TPT initiations that occur at households rather than at facilities as a result of the program, multiplied by the cost of TPT drugs
- Facility-based costs averted due to fewer incidents of TB disease is calculated as the number of TB cases averted due to increased TPT uptake, multiplied by the costs of TB diagnosis and drugs.
- $547,091 government TPT costs averted
- 252,543 children under-5 reached by the program
- $547,091 / 252,543 = $2 saved per child reached
- 80
This is offset by a reduced number of contacts with TB disease. See cost-effectiveness analysis.
- 81
- “Although successful treatment prevents death, many tuberculosis survivors experience ongoing health problems following the disease episode, and there is increasing evidence of long-term disability and elevated mortality risks in this population.2 … The term post-tuberculosis describes the range of pathological conditions experienced by tuberculosis survivors.” Menzies et al 2021
- “Post-TB morbidities include both physical impairments, such as chronic lung and other organ impairments, and psychosocial morbidities, including ongoing stigma, anxiety/depression, social isolation and persistent socioeconomic impairment.2 The true burden of each of these remains poorly described, although a growing literature describes shortened survival post-TB. Mortality rates for TB survivors may be as high as three times controls,3 while prevalence estimates for lung impairment after pulmonary TB vary from 18–87% depending on the population studied.” Allwood et al 2020
- 82
“The descriptive analysis includes long-term outcomes of 3529 paediatric patients 1 month to 36 years after confirmed (47%) or clinical (53%) tuberculosis. In a considerable proportion of children, a broad spectrum of post-tuberculosis sequelae were identified, ranging from radiological residua after pulmonary tuberculosis, to disabling deformities after musculoskeletal and cutaneous tuberculosis, to somatic and psychosocial impairment after tuberculous meningitis.” Igbokwe et al. 2023.
- 83
“These elevated risks reflect a combination of the causal impact of tuberculosis on future mortality risks and the effect of individual characteristics that are correlated with both mortality rates and tuberculosis disease, but not caused by tuberculosis. To decompose these two effects, we assumed that the causal effect of tuberculosis on future mortality can be estimated from the effects of tuberculosis on lung function, and the resulting effects of impaired lung function on mortality rates.” Menzies et al 2021
- 84
See Table 2; Menzies et al 2021
- 85
Intuitively, the Menzies et al 2021 estimate could either overstate or understate the true effect of TB on post-TB DALYs. It could overstate the effect if the effect of impaired lung function on mortality rates is smaller when the impaired lung function is due to tuberculosis (for example if the individuals who tend to get TB face higher mortality rates as a result of other factors that would have caused them to die prematurely even in the absence of TB). It could understate the effect if the causal effect of TB on post-TB DALYs runs through other channels in addition to impaired lung function. We apply a small downward adjustment because we think some degree of overstatement of the true effect is more likely than understatement, given our general impression that real causal effects tend to be smaller than estimates produced using non-randomized methods.
- 86
This is a rough estimate which takes the average age of a respiratory death in India (excluding under 5 deaths) from GBD 2021, and subtracts 10 years to account for morbidity risks manifesting in the decades before death. See this row of our cost-effectiveness analysis.
- 87
This discount rate is intended to capture temporal uncertainty only, in line with GiveWell’s approach to discounting health benefits that occur more than a few years into the future; see GiveWell, Discount rate 2020.
- 88
39,562 total units of value from averted post-TB sequelae / (110,660 + 3,325) total units of value from averted TB mortality and morbidity = 35%
- 89
See GiveWell, 2020 update on GiveWell's moral weights and in particular the comparison between GiveWell’s moral weights and those implied by a DALY framework in the figure on page 10 (‘YLLs’ shows the value of preventing a death in the DALY framework).
- 90
See cost-effectiveness analysis. The approach used here is the same as the approach used in GiveWell’s assessment of Vitamin A supplementation (see here for more details).
- 91
See this section of our report on insecticide-treated nets to prevent malaria.
- 92
- 93
- 94
See cost-effectiveness analysis, ‘additional benefits’ sheet
- 95
We assumed a rate of ~20% per year; see above
- 96
This ceiling coverage rate is based on our estimate of what percent of household contacts would agree to initiate TPT if offered it under a government-run program (we assume this is 90% of the 80% TPT participation rate that an NGO implementer could achieve; 80%*90%=72%).
- 97
Implementer confirmed this in review of this page (unpublished).
- 98
See Menzies et al 2021 Figure 1, Panel A: YLLs due to tuberculosis disease by age
- 99
See this article for more details about why we do not account for differences in life expectancies within age cohorts in our moral weights.
- 100
These adjustments account for: the larger number of household contacts in the ≥5 years category; the lower average moral weight GiveWell places on averting the deaths of older individuals; minimal effects on long-term income from averting TB after the age of 5; smaller effects from having to visit a facility for TPT initiation; transmission benefits which are generated from averting TB in older individuals but from averting TB in young children; higher pre-existing TB treatment rates for older individuals; and ongoing risk of developing TB for older individuals. See here for the values we place on each of these adjustments.
- 101
- 102
- 103
I.e. to what extent symptom-based screening predicts whether a child contact has TB. See cost-effectiveness analysis, ‘symptom-based screening’ sheet.
- 104
Implementer confirmed this in review of this page (unpublished).
- 105
- 106
We expect around 500 additional children with TB disease to be given TPT as a result of running this program in Bihar and Uttar Pradesh. This compares to around 90,000 additional children who we expect to be given either TPT (~88,000 children) or TB treatment (~1,000 children) as a result of this program. 500 / (88,000 + 1,000) = 0.6%.
- 107
See cost-effectiveness analysis for calculations. For a full introduction to our approach to leverage and funging adjustments, see this blog post.
We estimate that there is a relatively low (10%) chance that other philanthropic actors would fund this type of program in the counterfactual. This is a guess informed by conversations we had with TB funders, who gave us the impression that they had no specific plans to fund this program in the near future, and more generally that programs to increase uptake of TPT for under-5s are neglected compared to other types of TB programs. - 108
While we have vetted the calculations leading to the main estimates of room-for-more-funding in this model, we have not vetted the national and subnational source data that determines many of the inputs into these calculations.
- 109
This includes the following assumptions:
- Fixed costs (those that do not vary with the number of children reached) are 40% of the total non-commodity cost of the program in the first two years (see here)
- The remaining costs in the first two years scale with the number of children reached (see here)
- After the initial two years, the additional support needed to transition the program to full government ownership would have an annual cost that’s roughly half of the annual cost in the first two years of the program (see here)
- 110
Healthcare prices are sourced from https://www.theglobaleconomy.com/rankings/healthcare_prices_wb/, which cites the World Bank International Comparison Program as the ultimate source. Our understanding is that this is used as a proxy for differences in the implementer’s costs across countries.
- 111
Implementer confirmed this in review of this page (unpublished).
- 112
We have not looked into how these regions were selected but guess that they are regions with relatively high TB burdens.
- 113
The room for more funding model assumes that the program will be 8.5 times as cost-effective as cash transfers in the Indian states where it could be implemented. This is based on the estimated cost-effectiveness of the program in Bihar and Uttar Pradesh, around 10 times as cost-effective as cash ( assuming it’s roughly equally likely that the program is successfully transitioned to government or not transitioned to government at all) and an assumption that the program would be somewhat less cost-effective in other Indian states.
- 114
“Children and adolescents continue to experience a disproportionate burden of TB. WHO’s recently released Global Tuberculosis Report, highlights that an estimated 1.25 million children and young adolescents (aged 0-14 years) fell ill with TB in 2022, which is 12% of the global TB burden. Almost half were under 5 years of age. In the same year, more than 200,000 children and young adolescents died due to TB, representing 16% of all TB deaths. Among deaths in HIV-negative children and young adolescents 76% occurred in children under the age of 5 years. Almost all the children and young adolescents who died of TB did not have access to treatment.” World Health Organization, November 2023.
- 115
- $5,000 * 2% * 150,000 = $15,000,000 of RFMF per year
- $15,000,000 * 10 = $150,000,000 of RFMF over 10 years