Published: July 2012
Background
VillageReach was our top-rated organization for 2009, 2010 and much of 2011 and it has now received over $2 million due to GiveWell's recommendation. In November 2011, we ranked other organizations above VillageReach because we did not believe that VillageReach had short-term funding needs.
VillageReach ran a pilot project of its vaccine delivery system in 2002-2007 in the Mozambique province of Cabo Delgado. In 2008, VillageReach published an evaluation of this pilot project.1
Because VillageReach has received significant funding as a result of GiveWell's recommendation, we are following its progress closely. Through following VillageReach's current scale-up project in Mozambique, we have learned more about the challenges to high quality data collection in the country, and have sought to improve our understanding of the quality of the pilot project evaluation.
This page is intended to be a record of what we learned during our re-examination of VillageReach's pilot project. For our conclusions on the organization as a whole, please see our report on VillageReach.
Table of Contents
Summary
We have focused on the following in our re-examinzation of the pilot project:
Vaccine stockouts:
- Additional information we considered: In our initial review of VillageReach, we relied on a chart from VillageReach's evaluation showing the "% of health centers with stock-out of at least one type of vaccine" between July 2004 and April 2007. We requested the raw data from VillageReach, so we could review it ourselves.
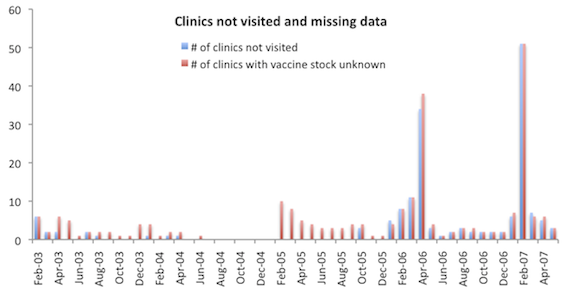
- Summary of what we learned: The raw data provided by VillageReach is consistent with the chart we used in our initial review. Nevertheless, there was a substantial amount of missing data – i.e., centers not reporting whether or not there were stockouts – during the pilot project. We were not aware of the existence of missing data before conducting this re-examination. While it is possible that missing data could lead to either overestimating or underestimating VillageReach's impact, our intuition is that, given the nature of VillageReach's project, missing data is more consistent with overestimating rather than underestimating VillageReach's impact.
Changes in vaccination rates:
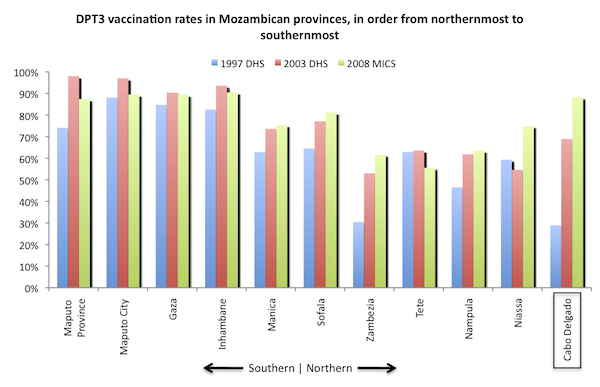
- Additional information we considered: In our review of VillageReach, we reproduced a chart from the evaluation that compares vaccination rates in Cabo Delgado and a neighboring province before and after VillageReach's pilot project. Below we use survey data that was not published at the time VillageReach completed its evaluation of the pilot project, and we also examine vaccination rates across all Mozambican provinces.
- Summary of what we learned: (1) Vaccination rates remained flat across most provinces in Mozambique during the period during which the pilot project took place. This fact strengthens the case for VillageReach's impact. At the same time, (2) 2010 survey data shows that Niassa, a province that neighbors Cabo Delgado and in which VillageReach was not present, experienced a large increase in vaccination rates during the course of VillageReach's pilot project. This fact is not new – a chart VillageReach presented in its evaluation of the pilot project also illustrates this fact – however the newer data finds a larger increase in Niassa than the older data did. This fact slightly weakens the case for VillageReach's impact.
Details
Stockouts
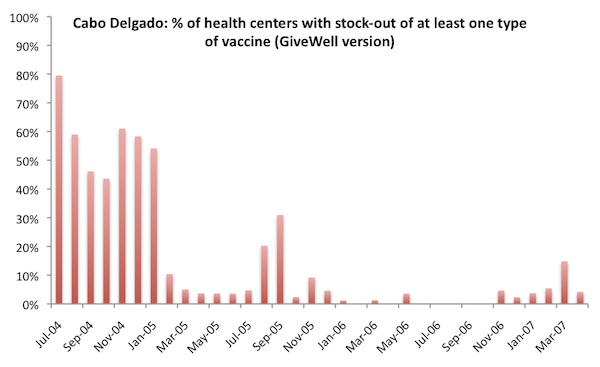
In the evaluation of the pilot project, VillageReach presents the following chart:
We have not seen the step-by-step details of how this chart was put together; however, VillageReach provided us with the data set that was used and we were able to put together a very similar chart (though not every data point matches with VillageReach's chart and we do not know what the cause of the discrepancies are):
Unless otherwise noted, all data and analysis in this section is based on the pilot project dataset VillageReach sent us. We are not cleared to share this dataset publicly.
Details on the data we used to create this chart:
- We considered stock levels of the five vaccine types monitored in VillageReach's data:2
- BCGExist: Quantity of BCG vaccine vials at the health center at the time of the visit.
- DPTHpBExist: Quantity of DPTHpB (combination diphtheria, tetanus, pertussis, and hepatitis B) vaccine vials at the health center at the time of the visit.
- VAP20Exist or VAP10Exist: Quantity of two sizes of polio vaccine vials at the health center at the time of the visit. A stockout of polio vaccine is defined as a stockout of both VAP20 and VAP10.
- VASExist: Quantity of measles vaccine vials at the health center at the time of the visit.
- VATExist: Quantity of tetanus vaccine vials at the health center at the time of the visit.
- A 'health center with stock-out of at least one type of vaccine' is defined as any health center that had a value of 0 for one or more of the 5 indicators above.
- Some of the data in the data set was collected during VillageReach's expansion project to the province of Nampula. We excluded this data from the charts.3
- We excluded health centers with missing vaccine stock data (defined as either the indicator ClinicNotVisited or the indicator VacExistUnknown entered as "true") from both the numerator and denominator of "% of health centers with stock-out of at least one vaccine." Since stockout data was generally collected during vaccine deliveries4 and failure to visit the clinic was a primary reason for missing data,5 we would expect health centers with data missing to be more likely than other health centers to have a vaccine stock-out (data was collected at the time vaccines are delivered), this assumption may show an inflated picture of VillageReach's impact. On the other hand, VillageReach told us that vaccines sometimes reached clinics without VillageReach staff visiting,6 and we note that periods of high missing data were not followed by high stockouts in the chart above, as might be expected if a missed VillageReach visit meant no vacines reached the clinic. Below we show the percentage of health centers with data missing in each month, as well as the percentage of health centers with stock-out of at least one vaccine. The denominator in this chart includes health centers with missing data.
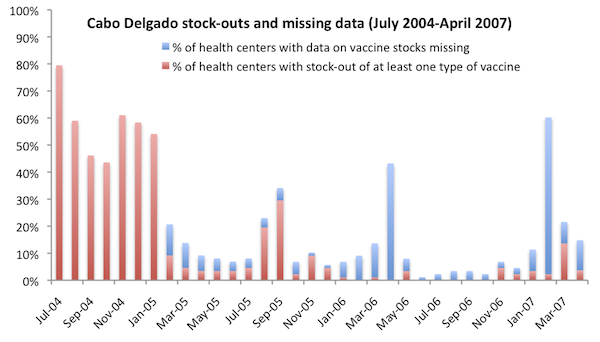
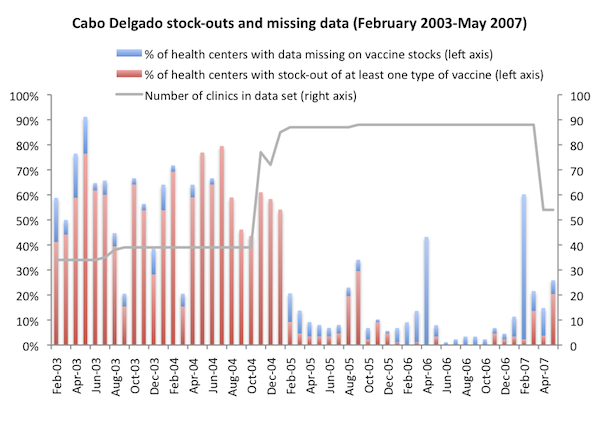
VillageReach's data set includes data from February 2003 to May 2007. The charts above, in attempting to recreate the stock-out chart created by VillageReach, only cover the period July 2004 to April 2007. For greater context, we show the full date range below.
VillageReach notes that prior to mid-2004, data was not gathered with a standard form, as a result "data points gathered aren't consistent for all data points all months during that time."7 It is not clear to us what this means for stock-out data specifically.
Discussion
Two observations from the full data set that were not clear to us from the original evaluation:
- Missing data was a problem throughout the project, and not accounting for missing data may result in under- or over-estimating stockouts. Because missing data indicates that the vaccine delivery team did not visit a clinic in a particular month, we would guess that stockouts were higher than average in clinics for which data is missing and thus failing to account for missing data could result in overestimating VillageReach's impact.
- Before 2005 stock-out rates were on the whole, but not consistently, high in comparison with after the start of 2005. This observation supports the idea that stock-outs were a common problem prior to VillageReach's intervention, but also suggests that it took a couple of years after the start of VillageReach's project for the intervention to be effective. We also note that while VillageReach describes the baseline stock-out rate as "almost 80% in 2004,"8
the average stockout rate prior to February 2005 was 53% of health centers.
VillageReach notes that the program was implemented in one part of the province before expanding to the whole province, and that stockouts dropped significantly within three months of the expansion.9 The data up to October 2004 is from 34-39 clinics; the number of clinics served by the program jumped to 77 in November 2004, and then remained steady at 87-88 in January 2005 to March 2007, before dropping in April 2007 when VillageReach handed over one of three project zones to government control.10
Vaccination coverage
In the evaluation of the pilot project, VillageReach presents the following chart:
Using data from the 1997 and 2003 Demographic and Health Surveys and the 2008 Multiple Indicator Cluster Survey (MICS) for Mozambique,11 we recreated the above chart and added data from other provinces for greater context. We note that VillageReach used data from its own survey for 2008 in the original evaluation, while we used survey data that was not available until 2010.12
We rely on the MICS data here because the same methods, in the same time frame, were used in both provinces. VillageReach's evaluation relied on a survey it conducted in Cabo Delgado in 2008 and a 2007 government survey from Niassa.13
Sources
- Hasselback, Leah. VillageReach Program Manager. Email to GiveWell, January 25, 2012.
- Hasselback, Leah, and Jessica Crawford. VillageReach Program Manager and Program Associate. Email to GiveWell, February 10, 2012.
- Kane, Mark. 2008. Evaluation of the project to support PAV (expanded program on immunization) in northern Mozambique, 2001-2008: An independent review for VillageReach with program and policy recommendations (PDF). Seattle: VillageReach.
- Kane, Mark. Private Consultant and Author of VillageReach pilot project evaluation. Phone conversation with GiveWell, September 6, 2011.
- Mozambique National Institute of Statistics. Demographic and health survey (1997) (PDF).
- Mozambique National Institute of Statistics. Demographic and health survey (2003).
- Mozambique National Institute of Statistics. Multiple indicator cluster survey (2008) (PDF).
- VillageReach. Data from pilot project in Cabo Delgado and Niassa. We have not yet received permission to post this document.
- 1
Kane 2008. The report was written by Mark Kane. Kane (2008) states, "Dr. Kane graduated from Brandeis University in 1969 and served in the Peace Corps. Following this, he went to Medical School at Penn State University at Hershey. He received pediatric training at Dartmouth and public health training at the Harvard School of Public Health. He then received EIS training at the US Centers for Disease Control and worked for the CDC for 20 years in the Divisions of Viral Hepatitis and Viral Diseases. For the last ten years of his CDC career Dr. Kane was seconded to the World Health Organization in Geneva where he worked in the Expanded Programme on Immunization (EPI) in charge of Hepatitis B Control and other New Vaccines. In 1999 Dr. Kane moved to Seattle to become the Director of the Children’s Vaccine Program at PATH. In that capacity he served on the Founding Board of GAVI, the GAVI working group, and was the Founding President of the Global Fund for Children’s Vaccines (later the Vaccine Fund and now the GAVI Fund). Dr. Kane retired at the end of 2005 and is now a private consultant in Seattle." Kane 2008, Pg 6.
While at PATH, Dr. Kane lead the children's vaccination program, which was an original funder of VillageReach. Mark Kane, phone conversation with GiveWell, September 6, 2011.
- 2
VillageReach confirmed our interpretation of these variables by email. Leah Hasselback, email to GiveWell, January 25, 2012.
- 3
VillageReach has assigned a "ClinicID" to each health center visit. Nampula clinics are denoted with a ClinicID starting with "2."
- 4
"In addition, VillageReach established a management information system (MIS) to track the Project’s operations and impact. The MIS tool provides reliable vaccine supply, demand and logistics information from the 'last mile' health centers. This information is collected on the monthly rounds of field coordinators." Kane 2008, Pg 11.
- 5
- 6
"When a health center is not visited, it does not mean that they don’t receive a distribution of vaccines. In most cases, the vaccines are distributed to the closest health center or the district or even to the health center itself (e.g. the road isn’t passable by vehicle but they could meet the health worker at the part of the road where it isn’t passable and distribute them there, thereby not visiting the health center and getting stock levels, but replenishing the stock). The main reason for not visiting a health center was from impassable roads. However, it is rare that a road is impassable for a long duration of time. Usually, it’s not passable when it rains but the next day or few days later, it is passable. Essentially, that means that their replenishment of vaccines happens a few days later. That increases the chances that they will have a stock out, but not so
dramatically that we can reasonably assume that not visiting means a stock out." Leah Hasselback, email to GiveWell, January 25, 2012. - 7
Leah Hasselback, email to GiveWell, January 27, 2012.
- 8
"The Project to Support PAV dramatically reduced stock-outs. Regularly less than 1% of health centers reported a stock-out in 2006 compared to almost 80% in 2004." Kane 2008, Pg 7.
- 9
"It also should be noted that the distribution system was implemented in phases in the
province such that it took from July 2002 – November 2004 for all of the health centers
to be included in the system. During those years of 2002 – 2004, the system was being
refined and tweaked to get to a point where it worked. We implemented in phases with
the first 5 districts in July 2002, 2 additional districts were added, and then the remaining 10 districts in November 2004 (http://villagereach.org/vrsite/wp-content/uploads/2009/07/VillageReach_…). A phased implementation gave us time to figure out how to run the system to get the results we were after, and you can see the stock outs drop once we reached that point (just 3 months after all the districts were included in the system). This is also why we ran a 5-year pilot project, but all expansions were planned for 3 years." Leah Hasselback, email to GiveWell, January 25, 2012. - 10
"From April 2007, one of the three zones in the province was fully transitioned (i.e. no DLS distributions, therefore no data)." Leah Hasselback, email to GiveWell, January 25, 2012.
- 11
Mozambique National Institute of Statistics, "Demographic and Health Survey (1997)."
Mozambique National Institute of Statistics, "Demographic and Health Survey (2003)."
Mozambique National Institute of Statistics, "Multiple Indicator Cluster Survey (2008)." - 12
Leah Hasselback, email to GiveWell, January 25, 2012.
- 13
"As part of the evaluation, Village Reach conducted a WHO Immunization 30 x 7 Coverage Cluster Survey in Cabo Delgado in July 2008...For a 'comparison' Province they used the neighboring province of Niassa, which had data from the DHS surveys in 1997 and 2003, and from an EPI cluster survey in 2007 conducted under the auspices of DPS for reasons unrelated to this Project."
