We have published a more recent review of this organization. See our most recent report on PSI.
To see how we rank PSI overall, see our list of top-rated charities.
More information:
PSI promotes and distributes materials throughout the developing world, particularly condoms and insecticide treated nets, which have been shown to save lives and improve health. PSI stands out from other charities working to improve lives in the developing world for both (a) focusing on programs with proven impact and (b) monitoring whether these programs are implemented effectively.
When used appropriately, condoms and insecticide treated nets can be very effective, costing less than $1000 per infant death averted (nets) or HIV infection averted (condoms). While we have not seen strong evidence that PSI's products are reaching intended recipients and are used appropriately and consistently, PSI is more transparent and results-driven than comparable charities. We thus feel more confident in its likely impact than in that of the vast majority of charities.
Table of Contents
Note: many of the notes in this report reference our work on PSI from our 2007-2008 report.
What do they do?
Activities
PSI promotes and distributes materials, particularly condoms and insecticide treated nets, to save lives and improve health in the developing world. Its largest program areas focus on preventing HIV/AIDS and reducing unwanted pregnancies (primarily through condom promotion/distribution) and reducing the burden of malaria (primarily by promotion/distribution of insecticide-treated nets (ITNs)).1

PSI breaks down it activities into four health areas:
- Malaria control: In 2008, malaria control comprised 34% of PSI's program spending.2 PSI's malaria control products include insecticide treated nets (both traditional and long-lasting), net retreatment kits, malaria treatments (both ACT and non-ACT), and malaria diagnostic kits.3
- HIV prevention: In 2008, HIV prevention comprised 32% of PSI's program spending.4 PSI's HIV prevention products include male and female condoms, voluntary counseling and testing, sexually transmitted infection kits, and lubricant.5
- Reproductive Health: In 2008, reproductive health comprised 30% of PSI's program spending.6 PSI's reproductive health products include a variety of contraceptive technologies, clean delivery kits, and nutritional supplements.7
- Child Survival: In 2008, child survival comprised 4% of PSI's program spending.8 PSI's child survival products include water purification chemicals, diarrhea treatments, and nutritional supplements.9
PSI has historically focused on selling products for below-market prices, seen in our 2007-2008 discussion of this topic, but also distributes some products for free. According to its Annual Sales and Health Impact Report for 2008, 48% of the estimated disability adjusted life years (DALYs) averted by PSI products were due to distribution of free products, up from 29% in 2007. The majority of this DALY reduction is attributed to distribution of free long lasting insecticide-treated nets (LLINs).10
Monitoring and evaluation
PSI expresses a commitment to relatively systematic monitoring and evaluation of its activities - particularly "MAP surveys," which aim to evaluate the availability (and appropriate marketing) of PSI's products in a region,11 and "TRaC surveys," which aim to evaluate relevant behavior change over time12 (for example, use of condoms and insecticide-treated nets - see the following section).
Results from TRaC reports are available online on PSI's website.13 Technical papers describing the methodology for data collection for specific TRaC surveys are also available on PSI's website.14
The surveys published online are numerous but not complete (details in the following section). Kim Longfield stated to us that many reports are sent to the U.S. office behind schedule (or not at all), which is the reason for the missing reports.15 It appears that no single overview or summary of these surveys are available, although we give a summary of publicly available data in the following section.
Does it work?
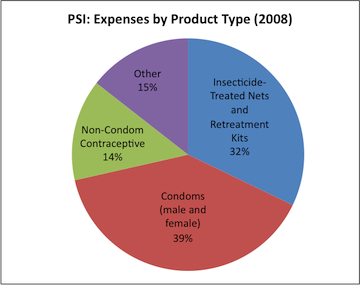
Both condoms and ITNs (which together comprise the bulk of PSI's expenses, as noted above) are proven to improve health (reducing the risk of HIV infection and malaria, respectively) when used correctly and consistently. For more, see our full reports on the promotion and distribution of condoms and ITNs.
Setting it apart from the vast majority of other charities, PSI conducts surveys to assess whether people use the products it sells and gives away. Data from these surveys indicates that PSI's products are likely being used (more below). It is unclear, however, whether the availability of PSI's products causes behavioral change (such as condom use by individuals who did not previously use condoms).
In May 2010, we reviewed the results of these surveys for all projects that have published data on PSI's website, looking at changes in condom use (for PSI's condom program)16 and changes in (a) ITN ownership and (b) ITN use by pregnant women and children under 5 (for the ITN program).17 In brief:
- Condoms: Those surveyed in approximately 40 PSI projects showed a small (1-6%, depending on gender and age group) average increase in condom use between the baseline survey (primarily from 2002-2004) and followup survey (primarily from 2005-2007).18 Condom use across African countries as a whole seems to follow a similar pattern.19
- ITNs: Surveys from 6 PSI projects showed a large increase in ITN ownership (17% average arithmetic increase) and use (14% among pregnant mothers; 16% among children under 5) in published surveys.20
We were unable to find independent survey data to determine whether these changes correspond to broader trends within Africa.
We are aware of at least one country where there was significant ITN-distribution activity outside of PSI: Kenya. We discuss Kenya's ITN distribution program in our program report for distribution of insecticde-treated nets; studies of the program credit PSI with a major role, but not with sole responsibility for the encouraging results. We find it slightly concerning that PSI's discussions of trends within Kenya do not mention the context of the large-scale government-led program that was taking place at the time.
Three other notes about the question of PSI's impact:
- PSI appears to be a dominant supplier of both condoms and ITNs within Africa.21 Thus, country- and continent-wide trends might be legitimately attributable to PSI's activities.
- Survey data implies that condom use among PSI's targeted groups is generally relatively high,22 although use of ITNs use is quite low.23 In the former case, there is some argument that the simple fact of high condom utilization rates implies that the condoms sold by PSI are likely being used.
- It can be argued that products that are sold may be less likely to be wasted than products that are given away. However, because PSI sells products at significantly below-market prices,24 it is possible that people buy them primarily to re-sell them, and that they do not ultimately end up benefiting low-income people.
Possible negative or offsetting impact
PSI sells products at significantly below-market prices (or distributes them for free), and may thus be effectively replacing or out-competing private provision of these products. We have little sense of the size of this potential problem. PSI did send us a paper proposing a method for assessing the value-added while considering the presence of other suppliers,25 but we have not seen its framework applied in PSI's actual monitoring and evaluation.
What do you get for your dollar?
In our 2007-2008 report, we roughly estimated that PSI's condom program prevents a case of HIV/AIDS for every every $500-1,000 it spends, and that its ITN program prevents a case of malaria for every $600-2,400 it spends.26 At that time, we did not have access to the details of PSI's own calculations; we now have the details of its calculations for both condoms27 and ITNs.28 We find its approach to be largely similar to the approach we took, but with more detail and more informational sources than we used. We therefore defer to PSI's own cost-effectiveness estimates, with the following caveats:
- PSI's condom estimate assumes a 10% wastage rate for purchased condoms29 and a 35% wastage rate for free condoms.30 No source is given for these estimates, and it appears that PSI's monitoring and evaluation does not include methods for determining actual wastage rates. We believe that the question of whether the condoms sold by PSI reach low-income people who use them consistently and appropriately is a major question.
- Similarly, PSI's estimate for ITNs includes the assumption that "each LLIN [a form of ITN] sold will protect on average 1.42 people, of which 0.55 of those will be aged 0-4 years," citing unspecified "studies."31 Given the high variation in ITN usage rates (described above) and the relatively small amount of data on them, we find the appropriateness of this assumption be particularly questionable.
It is normal for cost-effectiveness estimates to include many rough estimates and assumptions, but we have highlighted those that pertain directly to the efficacy of PSI's programs - i.e., we have highlighted questions about whether PSI's products are used as intended.
PSI's 2008 report on cost-effectiveness gives overall estimates by health area including:
- HIV: $1,310 per HIV infection averted.32 Using the conversion factor used by the Disease Control Priorities in Developing Countries report, $1,310 per prevented infection is equivalent to $65 per disability adjusted life year (DALY).33 PSI's own estimate puts its HIV programs at $42 per DALY.34 These figures are well within the range of $52-$112 per DALY ($1,040-$2,240 per HIV infection averted) estimated by an independent source (details in the cost-effectiveness section of our review of condom distribution programs).
- Malaria: $533 per child's life saved.35 Using the conversion factor implied by an independent source,36 $533 per life saved is equivalent to $16 per DALY. PSI's own estimate puts its malaria programs at $18 per DALY.37 This figure is consistent with other estimates of the cost-effectiveness of ITNs (more at our analysis of ITN cost-effectiveness).
PSI estimates its overall cost effectiveness at $29 per DALY for 2008.38
Room for more funds?
We have not seen a formal analysis of PSI's plans for future funds or of its perceived "funding gap." Kim Longfield stated to us that unrestricted funds are granted to regional programs based on a competitive application process.39
Financials/other
Unless otherwise noted, all data comes from:
- For 2002-2007: PSI, "IRS Form 990s (2002-2007)."
- For 2008: PSI, "Progress Report (2010)," Pg 24.
- For 2009: PSI, "Draft financial statement (2009)."
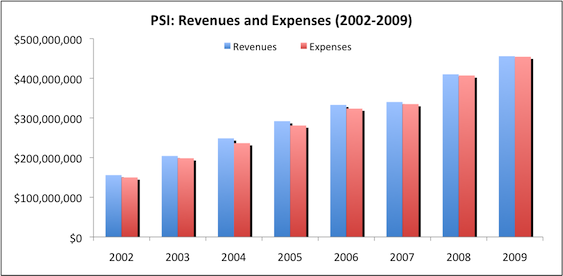
Revenue and expense growth (about this metric): PSI's revenues and expenses have grown consistently over the past 6 years.

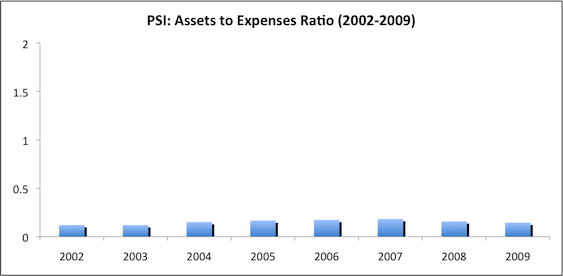
Assets-to-expenses ratio (about this metric): PSI maintains a low assets:expenses ratio. This may be because PSI receives a large portion of its support from governments, which may provide less volatile support, so that PSI does not need as large a reserve cushion as other charities.

Expenses by program area (about this metric): PSI spends the majority of its funds on its HIV/AIDS and malaria programs.40

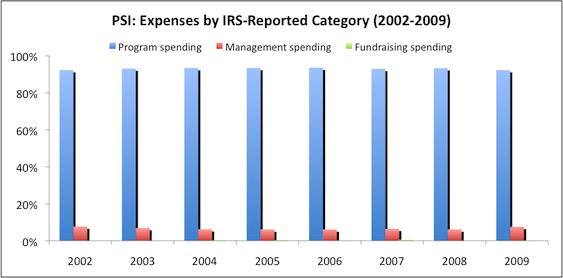
Expenses by IRS-reported category (about this metric): PSI maintains a reasonable "overhead ratio," spending approximately 93% of its budget on program expenses.

Unanswered questions
- Room for more funds. Does PSI have "funding gap" analysis available?
- Possible negative or offsetting impact. How does PSI determine whether it is adding to the supply of materials or replacing/outcompeting private sector provision of these materials?
Sources
- GiveWell. Condom promotion and distribution
- GiveWell. Guide to GiveWell's financial metrics.
- GiveWell. Insecticide-treated net distribution.
- GiveWell. Interpreting the DALY metric.
- GiveWell. PSI (2007-08).
- GiveWell. PSI expenses by product type (XLS).
- GiveWell. PSI market shares for condoms and ITNs (2008) (XLS).
- GiveWell. Summary of TRaC surveys (XLS).
- Jamison, Dean T. et al., eds. 2006. Disease control priorities in developing countries (2nd Edition) (PDF). New York: Oxford University Press.
- Longfield, Kim. PSI Director of Research. Phone conversation with GiveWell, May 26, 2009.
- Mathers, Colin D., Majid Ezzati, and Alan D. Lopez. 2007. Measuring the burden of neglected tropical diseases: The global burden of disease framework (PDF). PLoS Neglected Tropical Diseases 1, no. 2.
- Measure DHS. HIV/AIDS survey indicators database. http://www.measuredhs.com/hivdata/data (accessed June 28, 2010). Archived by WebCite® at http://www.webcitation.org/5qpQScntJ.
- PSI. Annual health impact report (2008) (PDF).
- PSI. Condom DALY brief (DOC).
- PSI. Condom DALY coefficient worksheet (XLS).
- PSI. Condom DALY model description (DOC).
- PSI. Cost effectiveness report (2006) (PDF).
- PSI. Cost effectiveness report (2007) (PDF).
- PSI. Cost effectiveness report (2008) (PDF).
- PSI. DELTA marketing lesson (PDF).
- PSI. Funding by program (XLS).
- PSI. IRS form 990:
- PSI. LLIN DALY brief (DOC).
- PSI. Long lasting insecticide-treated nets. http://www.psi.org/our-work/healthy-lives/interventions/long-lasting-in… (accessed June 28, 2010). Archived by WebCite® at http://www.webcitation.org/5qpQSvh8a.
- PSI. Performance review. http://web.archive.org/web/20070901145420/http://www.psi.org/research/s… (accessed June 28, 2010). Archived by WebCite® at http://www.webcitation.org/5qpQxuk5a.
- PSI. Population-based surveys (TRaC). http://www.psi.org/resources/research-metrics/studies/trac (accessed June 28, 2010). Archived by WebCite® at http://www.webcitation.org/5qpQTSqL5.
- PSI. Product and service availability and access studies (MAP). http://www.psi.org/resources/research-metrics/studies/map (accessed June 28, 2010). Archived by WebCite® at http://www.webcitation.org/5qpQTkfo4.
- PSI. Progress report (2010) (PDF).
- PSI. Publication catalogue. http://www.psi.org/resources/publications (accessed June 28, 2010. Archived by WebCite® at http://www.webcitation.org/5qpQUF4CY.
- PSI. Quarterly progress report (2007-2009) (PDF).
- PSI. Scorecard (April 2009) (PDF)
- PSI. Total market approach. PSI has asked that we keep this document confidential.
- 1
Data for chart from PSI, "Cost Effectiveness Report (2008)," Pg 77-80. Calculations in GiveWell, "PSI Expenses by Product Type."
- 2
PSI, "Cost Effectiveness Report (2008)," Pg 79.
- 3
PSI, "Cost Effectiveness Report (2008)," Pgs 15-16.
- 4
PSI, "Cost Effectiveness Report (2008)," Pg 77. The figure for HIV programs also includes TB treatment, which is not an HIV prevention method, but which accounted for only 0.03% of total spending.
- 5
PSI, "Cost Effectiveness Report (2008)," Pg 24-25.
- 6
PSI, "Cost Effectiveness Report (2008)," Pg 78.
- 7
PSI, "Cost Effectiveness Report (2008)," Pg 45-47.
- 8
PSI, "Cost Effectiveness Report (2008)," Pg 80.
- 9
PSI, "Cost Effectiveness Report (2008)," Pg 33-35.
- 10
PSI, "Annual Sales and Health Impact Report (2008)," Pg 3. LLINs are "long lasting insecticide-treated nets." PSI, "Long Lasting Insecticide-Treated Nets."
- 11
PSI, "Product and Service Availability and Access Studies (MAP)."
- 12
PSI, "Population-Based Surveys (TRaC)."
- 13
PSI, "Population-Based Surveys (TRaC)."
- 14
PSI, "Publications Catalogue." A keyword search for "TRaC study" results in a large number of such studies.
- 15
Kim Longfield, phone conversation with GiveWell, May 26, 2009.
- 16
Definition of condom use: "The 'C indicator' refers to condom use at last sex with a non-marital noncohabiting partner in the past 12 months. For sex workers, the 'C indicator' refers to the percentage of sex workers who used a condom at their last sex with a client, of all those who report having sex for money or material goods. For men who have sex with men, the 'C indicator' refers to the percentage of men who used a condom at last anal sex with a male partner, of those who have had anal sex with a male partner in the past 12 months." PSI, "Performance Review," click on "HIV/AIDS Indicators."
- 17
Definition of ITN use: "'Pregnant Women' contain two indicators: usage of net and usage of ITN, which refer to the percentage of pregnant women who slept under a mosquito net or an ITN the previous night, respectively. 'Children Under Five' contains two indicators: usage of net and usage of ITN, which refer to the percentage of children under five who slept under a mosquito net or an ITN the previous night, respectively. Some malaria surveys contained only information at the household level; others contained information at the individual level, or could be converted from household to individual data." PSI, "Performance Review," click on "Malaria Indicators."
- 18
GiveWell, "Summary of TRaC Surveys." Calculated data is on the "Summary" tab. Raw downloaded data is on other tabs. For most of these surveys, we do not know whether changes were statistically significant.
- 19
The following data is from Measure DHS, "HIV/AIDS Survey Indicators Database." Data is for males ages 15-49 in sub-Saharan Africa for the indicator "condom use at last sex with anyone." All countries in sub-Saharan Africa with data for two or more years are included.
Country Previous survey Most recent survey Condom use, previous survey (%) Condom use, most recent survey (%) Change in condom use (%) Benin 2001 2006 16% 16% 0% Burkina Faso 1999 2003 24% 31% 7% Cameroon 1998 2004 17% 32% 15% Ethiopia 2000 2005 6% 5% -1% Ghana 1998 2003 17% 20% 3% Guinea 1999 2005 16% 20% 4% Kenya 1998 2003 21% 18% -4% Malawi 2000 2004 15% 16% 1% Mali 2001 2006 10% 10% 0% Mozambique 1997 2003 7% 14% 8% Namibia 2000 2006 48% 57% 9% Nigeria 1999 2003 15% 18% 3% Rwanda 2000 2005 7% 6% -1% Tanzania 1999 2005 18% 21% 3% Uganda 2005 2006 16% 18% 2% Zambia 1996 2002 22% 21% -1% Zimbabwe 1999 2006 29% 25% -3% Average change (arithmetic) - - - - 3% Median change - - - - 2% - 20
GiveWell, "Summary of TRaC Surveys." Calculated data is on the "Summary" tab. Raw downloaded data is on other tabs.
- 21
In the 30 countries in which PSI works in sub-Saharan Africa, PSI averages a condom market share of 42.8% (data missing for 3 countries) and an ITN market share of 23.8% (data missing for 2 countries). Data from PSI, "Annual Health Impact Report (2008)," Pg 31. Calculations in GiveWell, "PSI Market Shares for Condoms and ITNs (2008)."
- 22
GiveWell, "Summary of TRaC Survey Data". Of the 62 total figures available for PSI's "most recent round" of surveys among men ages 15-49, 47 of these indicated over 50% condom usage at last sexual act, while 35 indicated over 75%. These numbers are broadly consistent with (although measured very differently from) the assumptions about condom use that PSI uses in its cost-effectiveness estimates for condoms: "Condom usage is estimated to be 10% with regular partner, 40% with casual and 60% with commercial partner," PSI, "Condom DALY Brief".
Because the survey relies on self-reported data, there is some risk that survey data overstates condom use, though we feel the risk is smaller with a factual question about recent activity (the question we examined) than it would be with more general questions about condom use.
- 23
GiveWell, "Summary of TRaC Survey Data." We considered all data available for PSI's "most recent round" figure for the "children under 5" question, which asks whether children under 5 in respondents' households slept under a net the previous night. Only 12 total figures were available, all of which found ITN usage rates below 40% and 7 of which found usage rates under 20%.
- 24
PSI's cost recovery rate was only 10-14% in 2001-2008 according to PSI, "Cost Effectiveness Report (2008)," Pg 4. Prices for PSI's products can be found in PSI, "Annual Health Impact Report (2008)," Pg 39.
- 25
PSI, "Total Market Approach."
- 26
See our 2007-2008 cost-effectiveness analysis for PSI.
- 27
PSI, "Condom DALY Brief," "Condom DALY Model Description," and "Condom DALY Coefficient Worksheet."
PSI, "LLIN DALY Brief."
"After adjusting for a 10% condom wastage rate, PSI estimates the number of new infection averted per condom." PSI, "Condom DALY Brief," Pg 2.
"The approach applies to free condom as well except that we assume an additional 25% wastage rate." PSI, "Condom DALY Brief," Pg 4.
PSI, "LLIN DALY Brief," Pg 1.
"The net cost of preventing an HIV infection was $1,310." PSI, "Cost Effectiveness Report (2008)," Pg 18.
"The estimates of cost per disability-adjusted life year (DALY) saved assume a uniform 20 DALYs lost per infected adult (Murray and Lopez 1996) and 25 DALYs lost per infected child (Marseille and others 1999) and do not account for the increasing proportion of people living with HIV/AIDS in developing countries who will have access to antiretroviral therapy over the coming years." Jamison et al. 2006, Pg 344.
PSI, "Cost Effectiveness Report (2008)," Pg 18.
PSI, "Cost Effectiveness Report (2008)," Pg 10.
Mathers, Ezzati, and Lopez (2007, Pg 8, Table 3) implies that each episode of malaria averted counts for 0.1 DALYs, and that 1 in approximately 320 cases (the ratio between deaths and episodes) results in a death and thus an additional 33 DALYs.
PSI, "Cost Effectiveness Report (2008)", Pg 10.
"PSI had an average net cost per disability-adjusted life year (DALY) of $28.95 in 2008." PSI, "Cost Effectiveness Report (2008)," Pg 1.
Kim Longfield, phone conversation with GiveWell, May 26, 2009.
- PSI, "Cost Effectiveness Report (2006)," Pg 7.
- PSI, "Cost Effectiveness Report (2007)," Pgs 74-77.
- PSI, "Cost Effectiveness Report (2008)," Pgs 77-80.
